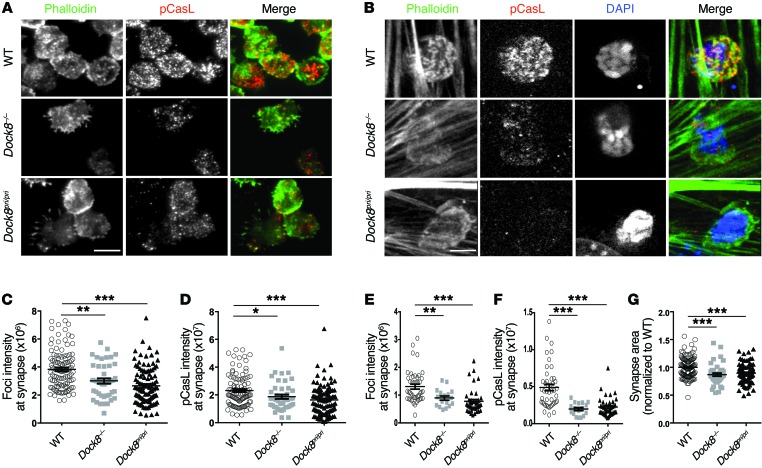
Figure 6. DOCK8 is essential for TCR-driven actin foci formation and mechanotransduction.
(A and B) Representative images of splenic CD4+ T cells from WT, Dock8–/–, and Dock8pri/pri mice plated on anti-CD3– and ICAM-1–coated glass chambers (A) or a superantigen-treated endothelial cell monolayer (B) and stained for F-actin (phalloidin, pseudocolored green) and pCasL (pseudocolored red). Orange indicates merging. The extracellular striated pattern observed in B (phalloidin panel on the left) is due to the F-actin fluorescence contributed by the endothelial cell cytoskeleton. Original magnification, ×100. Scale bar: 5 μm. (C–G) Quantitative analysis of actin foci (C and E), pCasL intensity (D and F), and synaptic area (G) in T cells. Each data point represents a value obtained for a single cell. Similar results (A–G) were obtained in 2 independent experiments. Error bars in C–G represent the mean ± SEM. ***P < 0.001, **P < 0.01, and *P < 0.05, by Student’s t test.

