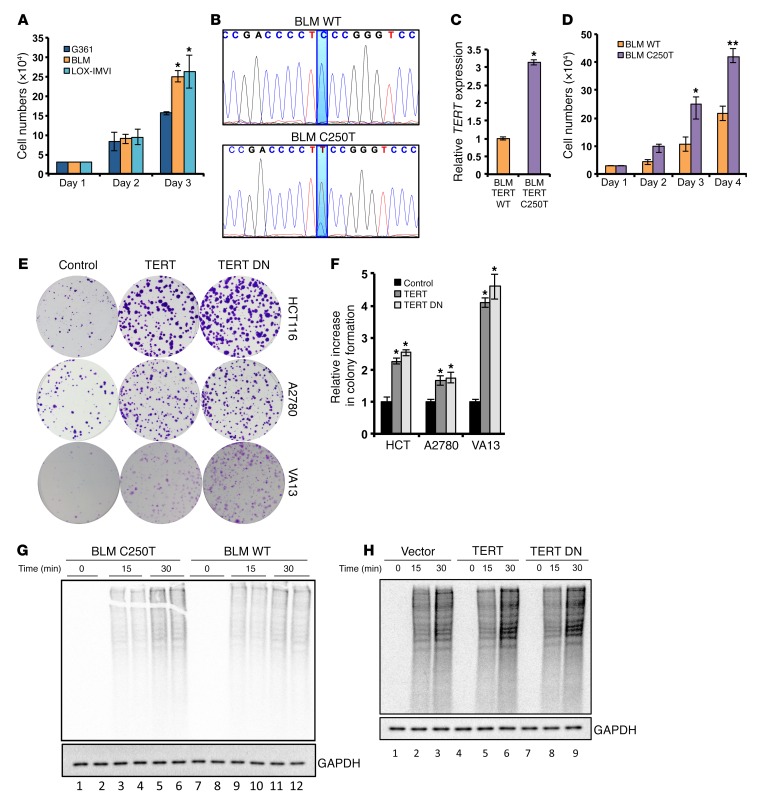
Figure 1. TERT increases proliferation and protein synthesis rates in cancer cells.
(A) Cell proliferation analysis for the melanoma cell lines G361, BLM, and LOX-IMVI. G361 was compared with BLM and LOX-IMVI. (B) The C250T mutation site in the TERT promoter was edited from thymine to cytosine residues in BLM cells using the CRISPR-Cas9 system. DNA chromatograms spanning the TERT promoter region are shown. (C) Relative TERT expression in BLM WT clone and BLM C250T clone. (D) Cell proliferation assay for BLM WT clone and BLM C250 clone. (E) Colony formation assay in HCT116 cells ectopically expressing TERT and TERT DN. (F) Quantification of colonies in E. (G and H) Methionine- and cysteine-starved cells (BLM WT clone and C250T clone in G and HCT116 cells infected with vector, TERT-, or TERT DN–expressing plasmids in H) were pulsed with S35-labeled methionine and cysteine. Following the indicated time points, cells were collected and lysed. Equal protein amounts were run on an SDS-PAGE gel, dried, and exposed for phosphor image analysis. Autoradiograms show global levels of the labeled proteins. A parallel gel was processed for Western blotting to detect total levels of GAPDH. Error bars indicate the mean ± SD. n = 3. 1-way ANOVA with Tukey’s multiple comparisons test was used for statistical analysis in A and F and a Student’s t test for B and C. *P < 0.05 and **P < 0.01.

