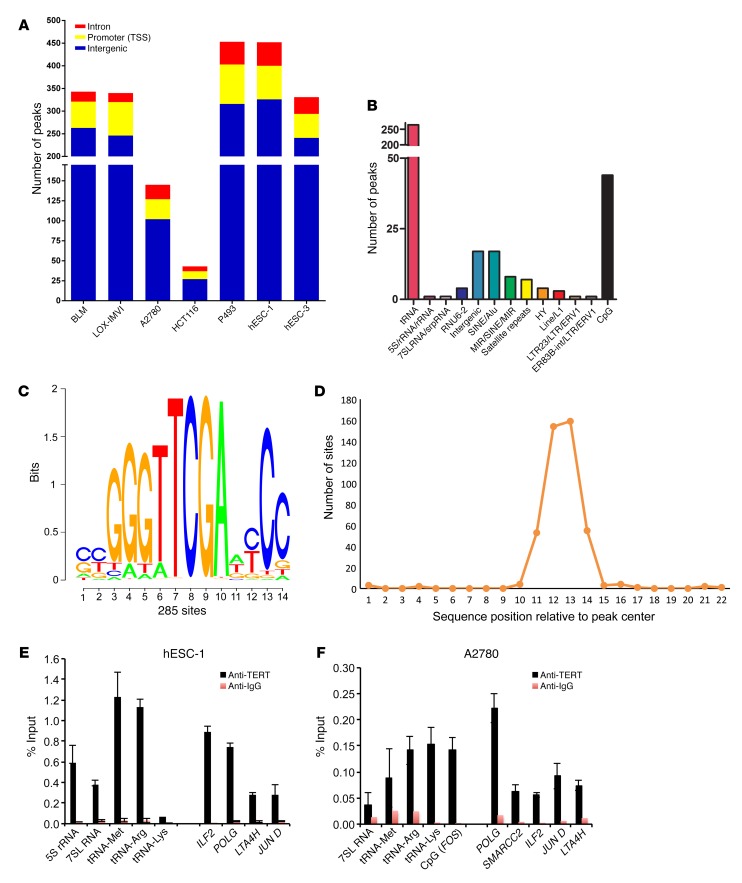
Figure 3. Annotation of TERT ChIP-seq peak regions.
(A) Broad annotation of TERT ChIP-seq peaks in various cell types. (B) Detailed annotation of intergenic peak regions of TERT ChIP-seq peaks in hESC-1 cells. (C) Sequence logo of the motif obtained from peak regions of TERT ChIP-seq in hESC-1 cells; 285 peaks of 463 peaks showed that this sequence was enriched. (D) Graph shows that the enriched motif was in the center of the regions bound by TERT. (E and F) ChIP using TERT and IgG Abs, followed by qPCR with primers specific for the indicated target regions and cell lines. Error bars indicate the mean ± SD. n = 3. CpG (FOS) represents CpG region upstream of FOS promoter.

