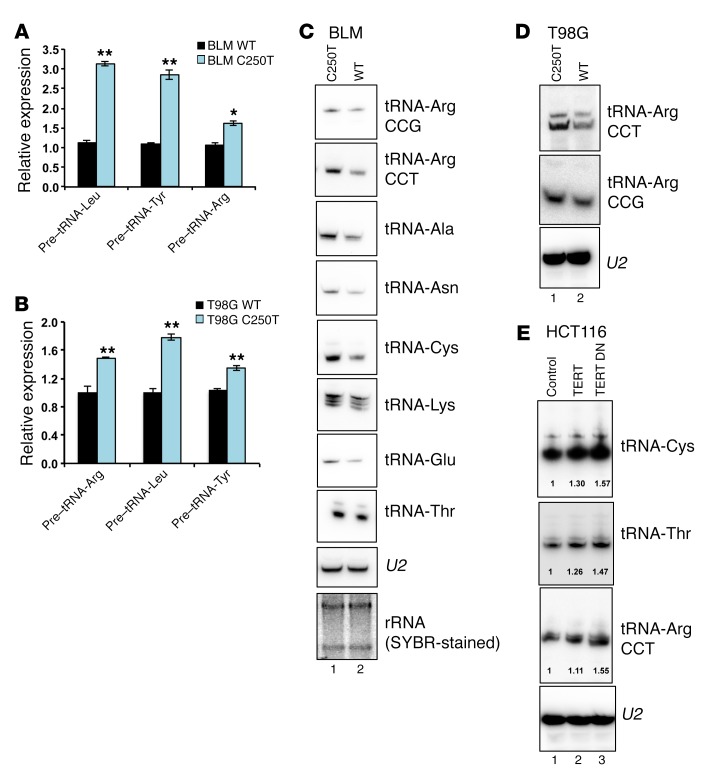
Figure 4. TERT regulates tRNA expression.
(A and B) Gene expression analysis of tRNA pretranscripts in the indicated cell lines. Expression was normalized to actin levels. Error bars indicate the mean ± SD. n = 3. *P < 0.05 and **P < 0.01, by Student’s t test. (C) Northern blot analysis of tRNAs in BLM WT and C250T cells. (D) Northern blot analysis in T98G WT and C250T clone cells. (E) Northern blot analysis in HCT116 cells infected with vector, TERT-, or TERT DN–expressing plasmids. Quantification of expression was done using ImageJ (NIH)and is indicated in the blots. U2 RNA was used as the loading control for Northern blotting. Total RNA is shown in agarose gel stained with SYBR Green as an RNA loading control. C and E blotting was repeated 2 times, and 1 experiment is represented.

