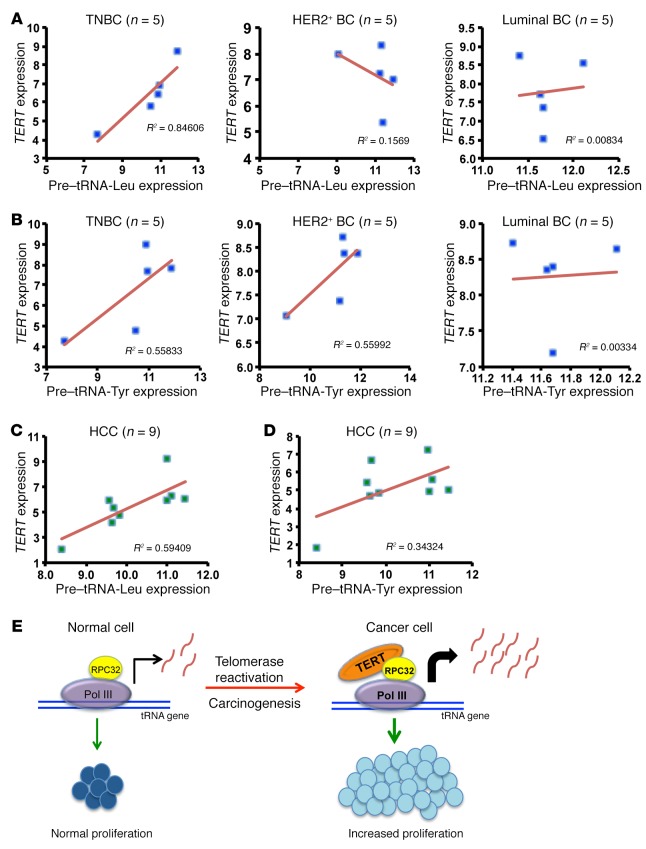
Figure 9. Correlation analysis between TERT and pretranscripts of tRNAs in cancers.
(A and B) Correlation analysis between TERT and pre–tRNA-Leu and pre–tRNA-Tyr expression in breast cancer (BC) types (n = 5 of each type) which include TNBC, luminal breast cancer, and HER2+ breast cancer. ΔCt values were plotted for the analysis, and R2 values were calculated in Microsoft Excel. (C and D) Correlation analysis between TERT and pre–tRNA-Leu and pre–tRNA-Tyr expression in RNA extracted from patients’ HCC cells (n = 9). ΔCt values were plotted for the analysis, and R2 values were calculated in Microsoft Excel. (E) Model shows that normal cells do not express TERT and thus have normal proliferation. Upon telomerase reactivation in cancer cells, TERT is expressed. TERT associates with the RPC32 subunit of RNA pol III and augments tRNA expression. This increase is responsible for the increased proliferation of cancer cells.

