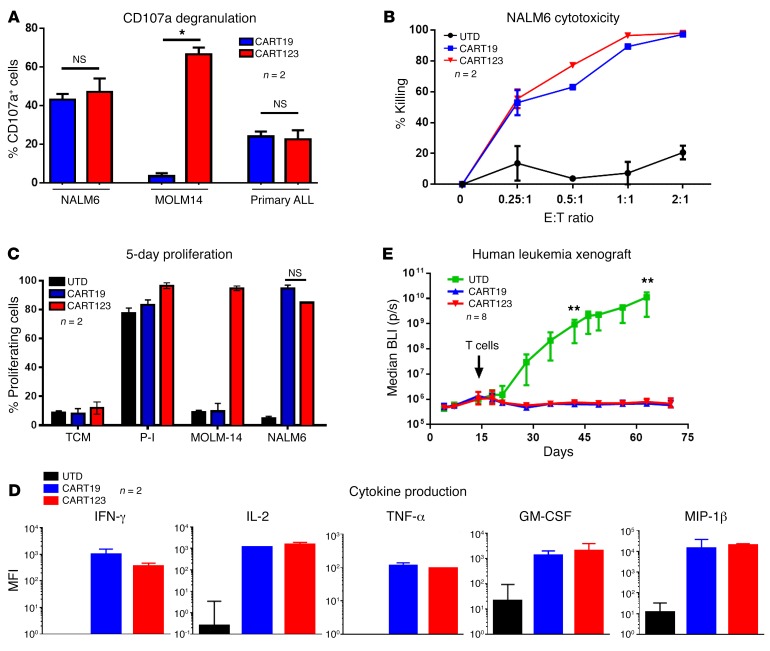
Figure 2. CART123 exerts potent antileukemia activity in vitro and in vivo.
(A) CART123 and CART19 cells were cocultured with B-ALL blasts (the cell line NALM6 or primary blasts, CD19+, CD123+) or a CD19-negative cell line (the CD123+ AML cell line MOLM-14) for 4 to 6 hours. Both CART123 and CART19 showed similar expression of CD107a, a marker of degranulation/activation when cocultured with NALM6 and primary ALL, while only CART123 recognized the CD123+ and CD19– cell line MOLM-14. (B) Cytotoxicity at 24 hours of CART123, CART19, or control T cells (UTD) when cocultured at different E:T ratios with NALM6. Increasing concentration of either CART123 or CART19 led to similar levels of killing of NALM6, while no killing was observed in the control group (UTD). (C) CFSE-stained CART123, CART19, or UTD was cocultured with medium only (TCM), PMA-ionomycin (nonspecific stimulus), MOLM-14 (CD123+, CD19–), or B-ALL blasts (NALM6 or primary blasts, CD19+, CD123+) for 5 days at a 1:1 E:T ratio; then CFSE dilution was analyzed by flow cytometry. High proliferation was observed in both CART123 and CART19 when cocultured with B-ALL blasts, but not in controls (UTD). As a control, CART123 also proliferated with MOLM-14. TCM, tissue culture medium. (D) Cytokine production by CART123, CART19, or UTD incubated with NALM6 for 3 days at 1:1 E:T ratio was analyzed in the culture supernatants. Significant production of several cytokines is noted in CART 19 and CART 123 groups, but not in UTD. (E) Luciferase-positive primary B-ALL blasts (patient UPN#11) were injected in NSG mice, and after 14 days, mice were randomized based on tumor burden to receive either CART123, CART19, or control T cells (UTD). Mice receiving CART123 or CART19, but not UTD, showed quick leukemia remission that was maintained in the long term. All graphs are representative of at least 2 independent experiments. Student’s t test was used to compare 2 groups; in analysis where multiple groups were compared, 1-way ANOVA was performed with Holm-Šidák correction for multiple comparisons. When multiple groups at multiple time points/ratio were compared, Student’s t test or ANOVA for each time point/ratios was used. *P < 0.05; **P < 0.01.

