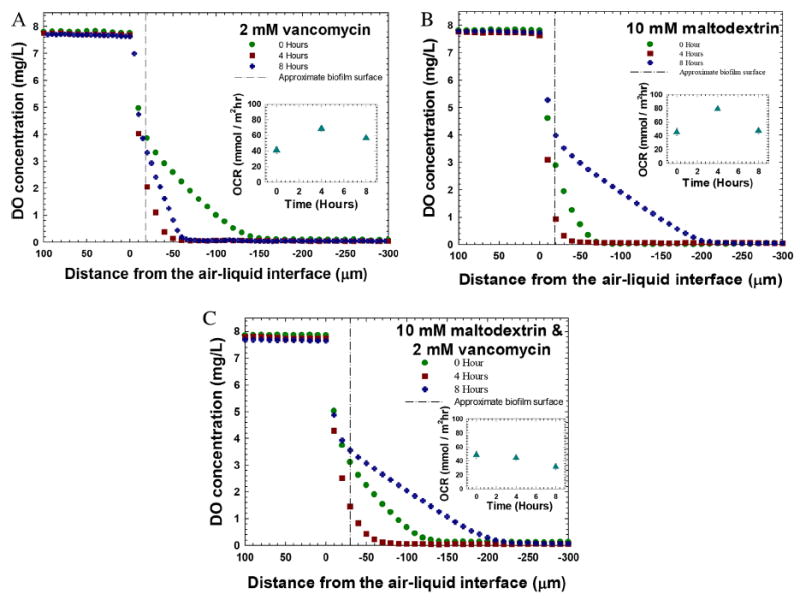
Figure 4.

Dissolved oxygen depth profiles measured before and after the treatments. A: Treatment with vancomycin. The oxygen consumption rate (OCR) showed an increase after 4 h and a gradual decrease after 8 h of treatment (inset). B: Treatment with 10 mM maltodextrin. The oxygen consumption rate showed an increase and then a decrease (inset). C: Treatment with 10 mM maltodextrin and 2 mM vancomycin. The oxygen consumption rate showed a gradual decrease throughout the 8-h treatment (inset). The initial horizontal lines show the location of the biofilm surface. For all figures the zero hours refer to biofilms grown for 72 h.
