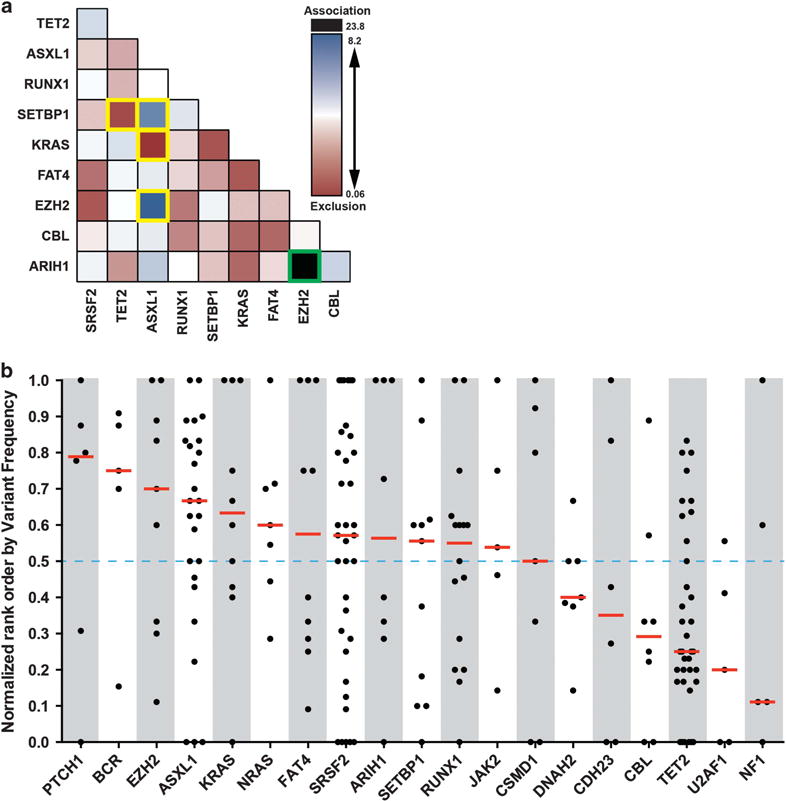
Figure 4.

Gene mutation concomittance and estimated order of appearance. (a) Concomittance of gene mutations in CMML patients (N = 69). Color shading represents estimated logit odds ratio (black and blue indicate mutations are mutually inclusive, red if mutually exclusive). Unadjusted associations with P<0.05 by Fisher’s exact test are boxed in yellow, Bonferroni adjusted association with P<0.05 boxed in green. (b) Normalized rank order of gene mutations (using first gene mutation when multiple, higher rank order values indicate later occurring mutations) in relation to total genes mutated per patient estimated from tumor variant frequencies (N = 69).
