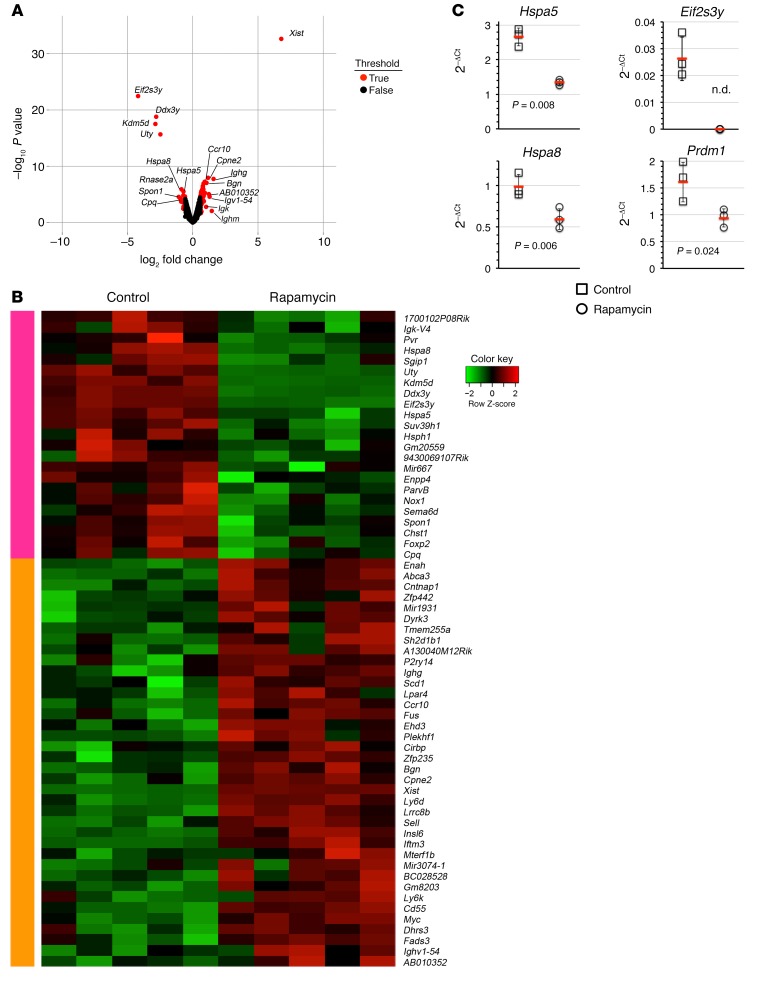
Figure 5. mTOR signaling regulates genes required for efficient protein translation in plasma cells.
B6.BLIMP1+/GFP mice were treated with rapamycin 7 times over 16 days, and B220− BM plasma cells were sorted for microarray analysis. (A) Volcano plot comparing the fold change (log2) versus P values associated with gene expression in BM plasma cells. Genes that exceeded a 1.5-fold change are highlighted in red. (B) Heat map comparing differentially expressed genes in BM plasma cells from control and rapamycin-treated mice. Each column represents the gene expression profile for B220− plasma cells sorted from a single mouse; data indicate the row Z score. (C) Control or rapamycin-treated B220− BM plasma cells were sorted from 3–4 individual B6.BLIMP1+/GFP mice for cDNA synthesis, and levels for the indicated genes were quantified using qRT-PCR with Taqman probes. Symbols indicate results for individual mice, red lines indicate mean 2–ΔCt values, and error bars indicate standard deviations. Indicated P values were determined by Student’s t test comparing control and treated mice. n.d., not detected.

