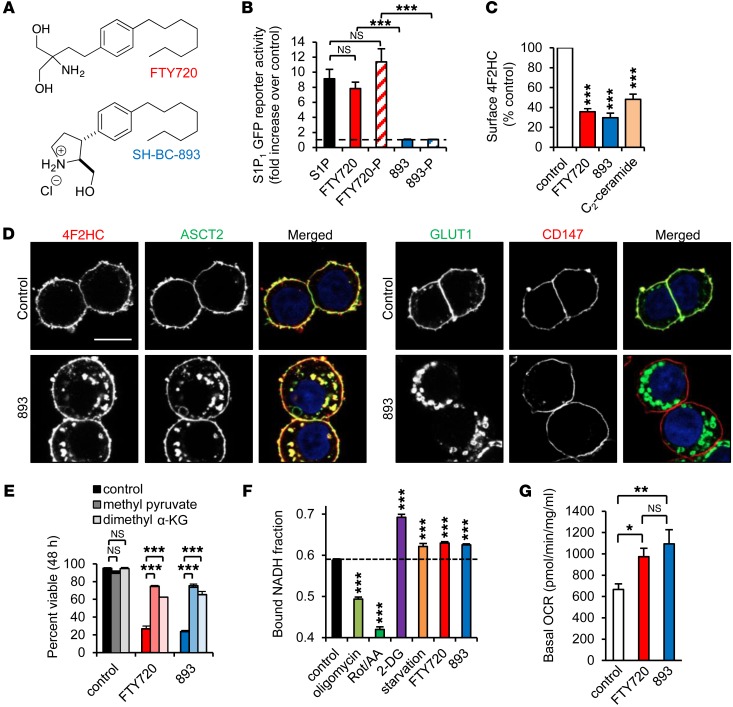
Figure 1. SH-BC-893 triggers nutrient transporter internalization mimicking starvation.
(A) Structures of FTY720 and SH-BC-893. (B) S1P1 receptor–driven GFP expression measured by flow cytometry in reporter MEFs after a 24-hour incubation with the indicated compounds at 2.5 μM. 893, SH-BC-893; 893-P, (SH-BC-893-phosphate); FTY720-P, (FTY720-phosphate). (C) Surface 4F2HC measured by flow cytometry in FL5.12 cells treated with 5 μM FTY720 or SH-BC-893 or 10 μM C2-ceramide. (D) SH-BC-893–treated SW620 cells stained as indicated. Scale bar: 10 μm. (E) Viability of BCLXL-overexpressing FL5.12 cells treated as indicated, with or without 5.5 mM methyl pyruvate or 2 mM dimethyl α-ketoglutarate (α-KG). (F) Bound NADH fraction in MEFs treated with mitochondrial inhibitors (1 μM oligomycin or 1 μM rotenone and antimycin A [Rot/AA]), 1 mM 2-DG, 5 μM FTY720, or 7.5 μM SH-BC-893 for 16 hours. For starvation, growth media were replaced with DMEM lacking glucose and amino acids, supplemented with 10% dialyzed FCS. Statistical significance was compared with respective controls. (G) Oxygen consumption rate (OCR) in MEFs treated with FTY720 or SH-BC-893 for 16 hours measured by an XF24 Extracellular Flux Analyzer (Seahorse Bioscience). Error bars indicate the mean ± SEM. *P <0.05, **P < 0.01, and ***P <0.001, by unpaired, 2-tailed Student’s t test. P values were determined using Tukey’s method when correcting for multiple comparisons. Data are representative of at least 3 independent experiments.

