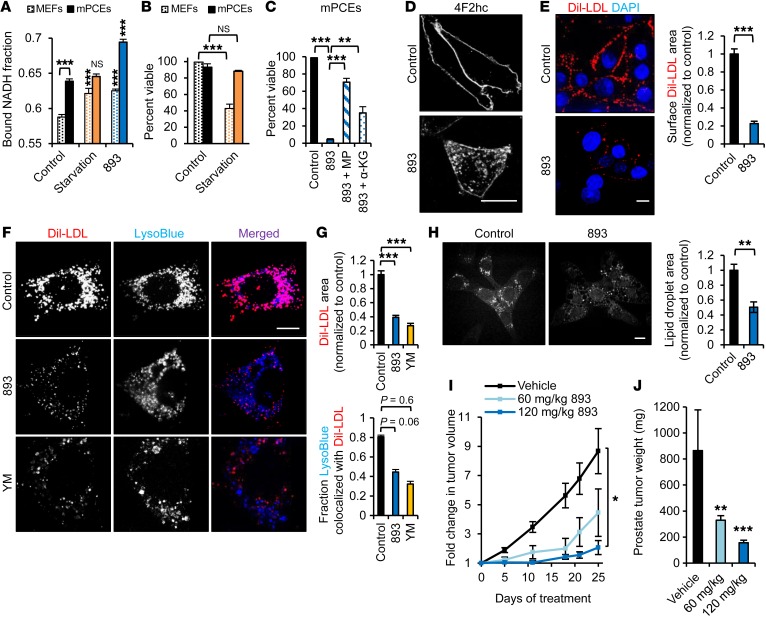
Figure 8. SH-BC-893 starves Pten–/– prostate cancer cells.
(A) Bound NADH fraction in MEFs or mPCEs. Error bars indicate the mean ± SEM. n ≥50 cells evaluated per condition. (B) Viability of MEFs or mPCEs in starvation media (DMEM lacking glucose and amino acids supplemented with 10% FBS). (C) Viability of mPCEs treated with 5 μM SH-BC-893, with or without 11 mM methyl pyruvate or 7 mM dimethyl α-ketoglutarate. Error bars indicate the mean ± SEM. (D) mPCEs treated with 5 μM SH-BC-893 stained for 4F2HC. (E) Dil-LDL bound to surface LDL receptors of mPCEs maintained at 4°C. Error bars indicate the mean ± SEM. n ≥80 cells per condition. (F and G) Dil-LDL uptake and lysosomes in mPCEs treated with SH-BC-893 or YM201636. Quantification of total Dil-LDL area (F) and colocalization of Dil-LDL with LysoTracker Blue (G). Error bars indicate the mean ± SEM. n ≥30 cells per condition. (H) mPCEs treated with SH-BC-893 for 3 hours were imaged using CARS to detect lipid droplets. Error bars indicate the mean ± SEM. n = 5 fields. (I) Growth of mPCE s.c. isografts measured by calipers. n = 7 per group. (J) Mean weight of autochthonous prostate tumors at sacrifice. n = 9 for the vehicle-treated and the 60 mg/kg SH-BC-893 groups; n = 8 for the 120 mg/kg group. Statistical significance was compared with respective controls unless otherwise indicated. *P < 0.05, **P < 0.01, and ***P < 0.001, by unpaired, 2-tailed Student’s t test (A–C, E, and G–I) and Mann-Whitney U test for comparison of treated mice with controls (J). P values were determined using Tukey’s method when correcting for multiple comparisons. Scale bars: 20 μm. LysoBlue, LysoTracker Blue.

