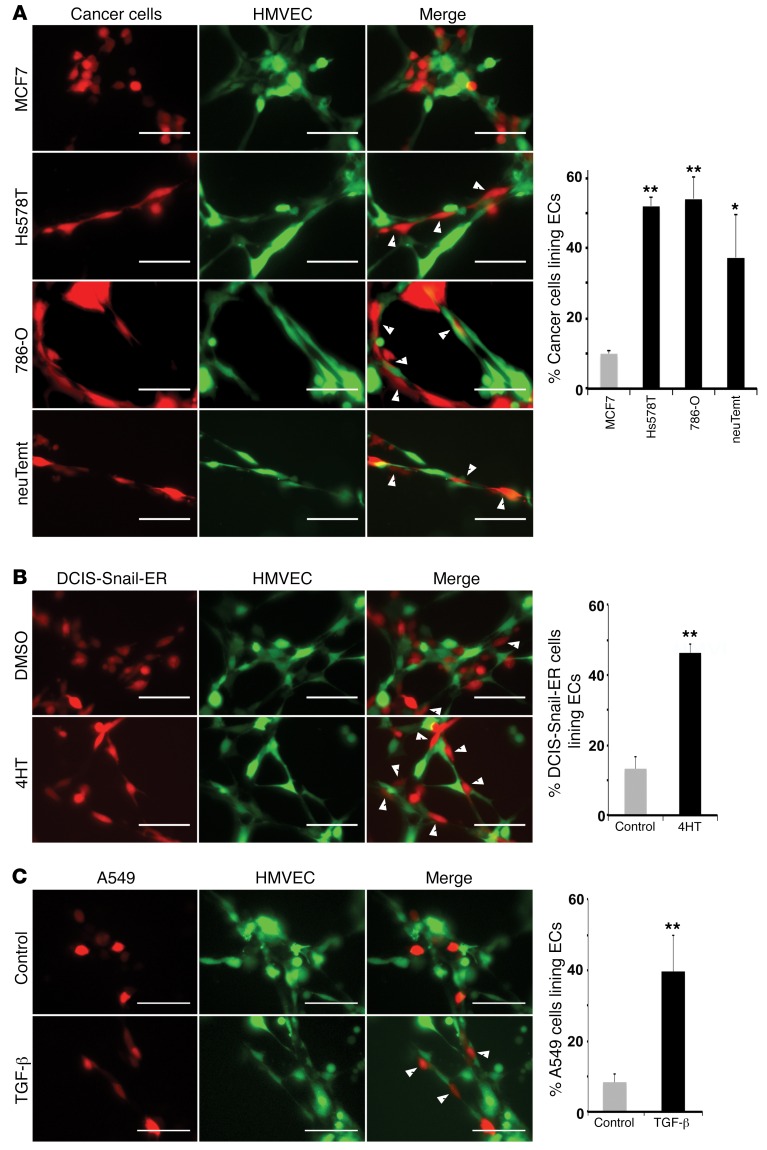
Figure 4. Mesenchymal/EMT cancer cells interact with endothelial cells in a coculture tube formation assay.
Red-colored epithelial or mesenchymal cancer cells (A), DCIS-Snail-ER cells (pretreated without or with 4HT for 2 days) (B), and A549 cells (preincubated without or with TGF-β for 2 days) (C) were mixed with green-colored HMVECs and coplated on Matrigel for tube formation. Photographs were taken 6 hours after seeding. Cancer cells exhibiting extensive interactions with ECs are indicated by white arrowheads and quantified (right panels). Scale bars: 50 μm. Error bars represent SD (n = 4–6). *P < 0.05, **P < 0.01. Statistical differences were determined by 2-tailed Student’s t test.

