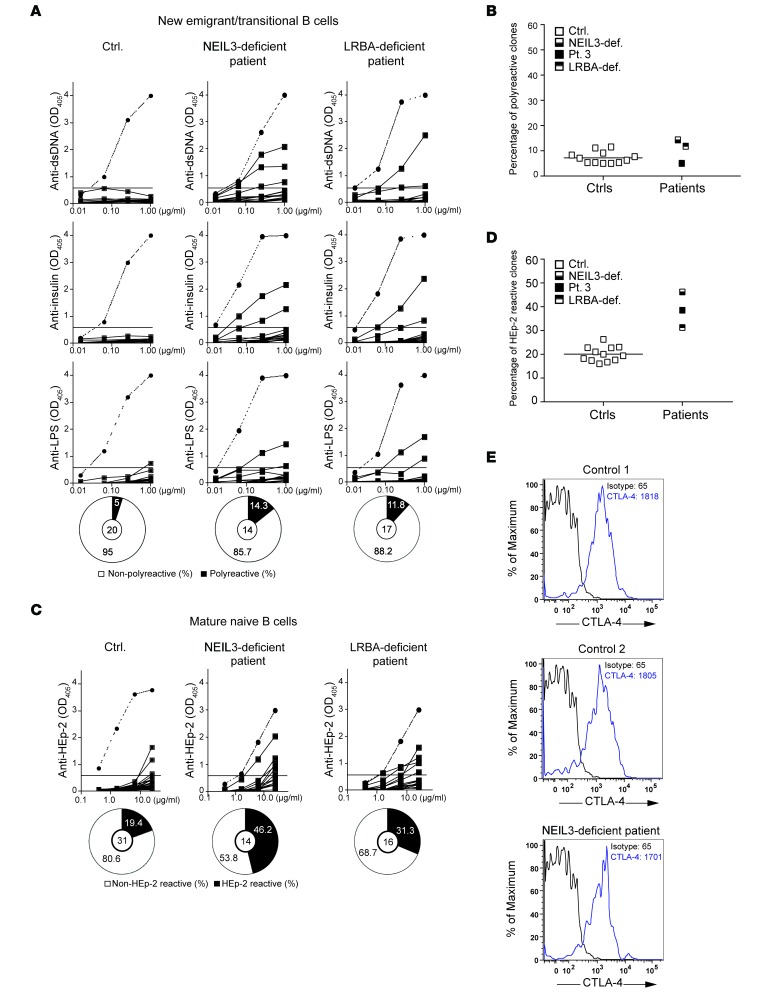
Figure 6. Defective peripheral B cell tolerance checkpoint in the NEIL3-deficient subject and in an LRBA-deficient patient.
(A) Reactivity of recombinant antibodies expressed by single new emigrant/transitional B cell clones from a representative healthy age-matched control, the NEIL3-deficient subject, and an LRBA-deficient patient against dsDNA, insulin, and LPS tested by ELISA. Dotted lines show the results from a positive control designated ED38. Horizontal lines show the OD405 cutoff for positive reactivity. The frequencies of polyreactive B cells are summarized in the pie charts, with the number of antibody-secreting B cell clones tested shown in the center. Clones are considered polyreactive when they recognize all 3 antigens. (B) Percentage of polyreactive new emigrant/transitional B cell clones from the NEIL3-deficient subject (NEIL3-def.), the LRBA-deficient patient, patient 3, and 12 controls. (C) Reactivity of recombinant antibodies expressed by single mature naive B cell clones from a control, the NEIL3-deficient subject, and the LRBA-deficient patient against lysates of HEp-2 cells tested by ELISA. Dotted lines show the results from the positive control ED38. Horizontal lines show the OD405 cutoff for positive reactivity. The frequencies of HEp-2– and non–HEp-2–reactive B cells are summarized in the pie charts, with the number of antibody-secreting B cell clones tested shown in the center. (D) Percentage of HEp-2–reactive mature naive B cell clones from the NEIL3-deficient subject, the LRBA-deficient patient, patient 3, and 12 controls. The percentage of reactive clones from patient 3 represented in Figure 2 was added to B and D for comparison with the subject with NEIL3 deficiency and the patient with LRBA deficiency. Each symbol represents 1 individual. The horizontal bar represents the mean of the controls. (E) Intracellular CTLA-4 staining in Tregs from 2 controls and the NEIL3-deficient subject. The numbers in the plots represent mean fluorescence intensity (MFI).

