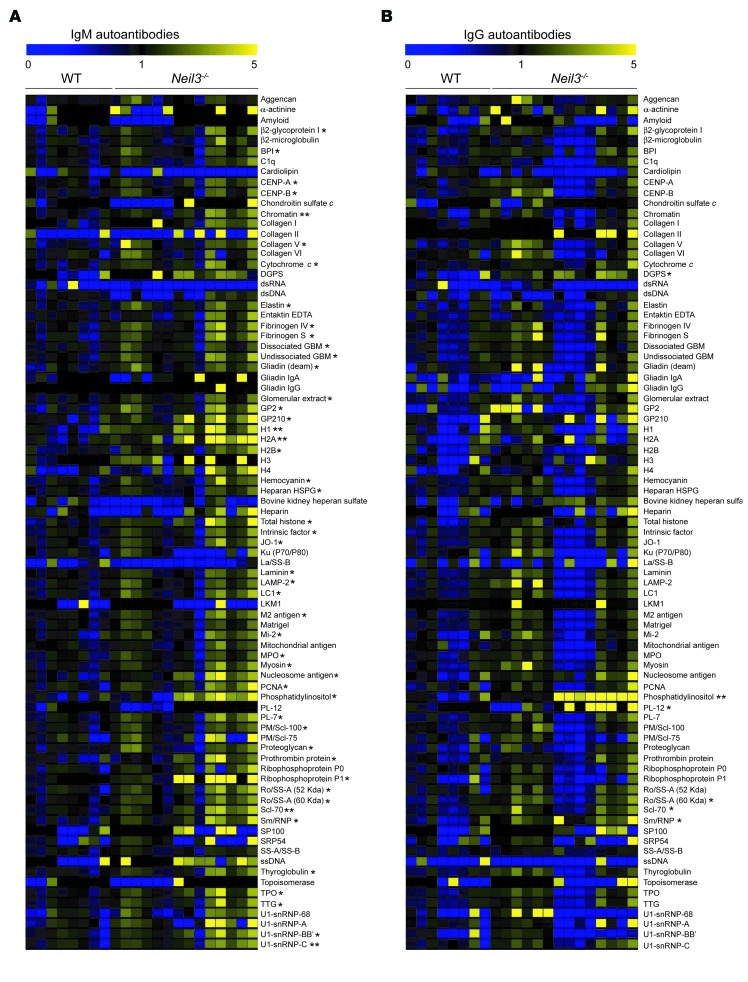
Figure 7. Elevated levels of autoantibodies in the sera of Neil3–/– mice.
(A and B) Heat map display of IgM (A) and IgG (B) autoantibody reactivity against self-proteins in the sera of Neil3–/– mice compared with WT controls. A value of 1 is equal to the mean of the WT. Thirteen Neil3–/– and 9 WT mice were used in this assay. P values were obtained by 2-tailed Student’s t test. *P < 0.05; **P < 0.01.

