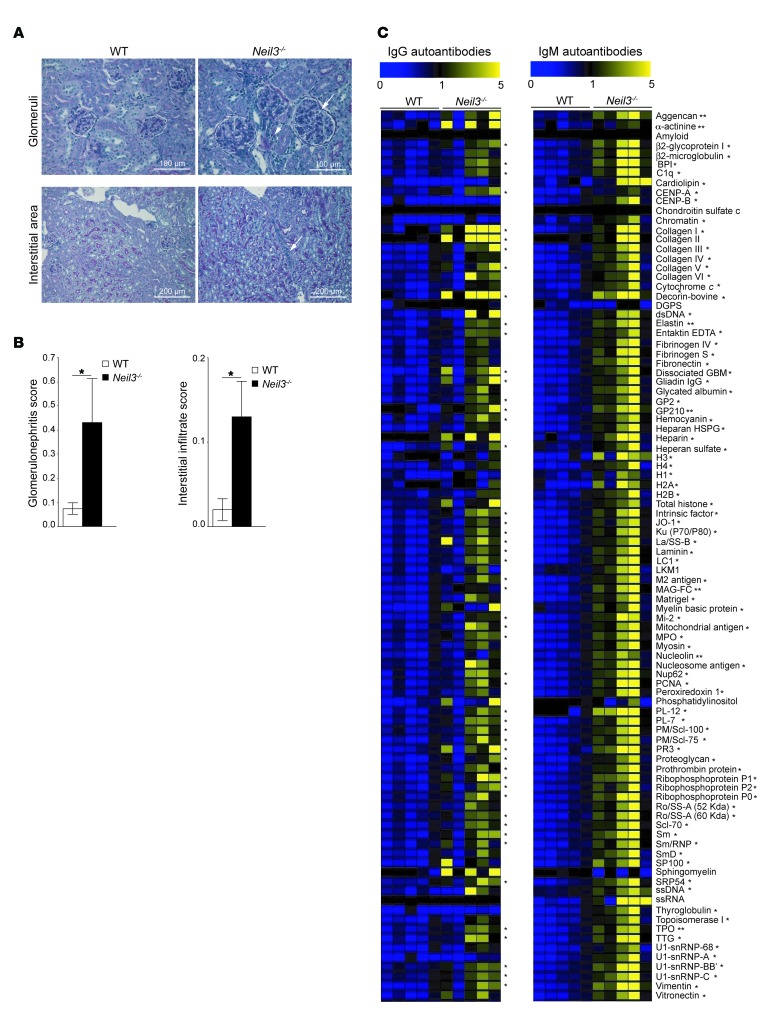
Figure 8. Poly(I:C)-induced glomerulonephritis in the kidneys and elevated levels of autoantibodies in the sera of Neil3–/– mice.
(A) Representative photomicrographs of kidney sections stained with PAS from Neil3–/– mice and WT controls treated with poly(I:C). Kidney sections from Neil3–/– mice show glomerulonephritis with periglomerular infiltrates (upper right panel, arrows) and interstitial infiltrate (lower right panel, arrow). Original magnification, ×40 (upper panels); ×20 (lower panels). Data are representative of 10 mice per group. (B) Histologic scores of glomerulonephritis and interstitial infiltrates, scored according to ref. 77. Columns and bars represent mean ± SEM of 10 mice per group. P values were obtained by 2-tailed Student’s t test. (C) Heat map display of IgM and IgG autoantibody reactivity against self-proteins in the sera of poly(I:C)-treated Neil3–/– mice and WT controls (n = 5 mice per group). A value of 1 is equal to the mean of the poly(I:C)-treated WT controls. P values were obtained by 2-tailed Student’s t test. *P < 0.05; **P < 0.01.

