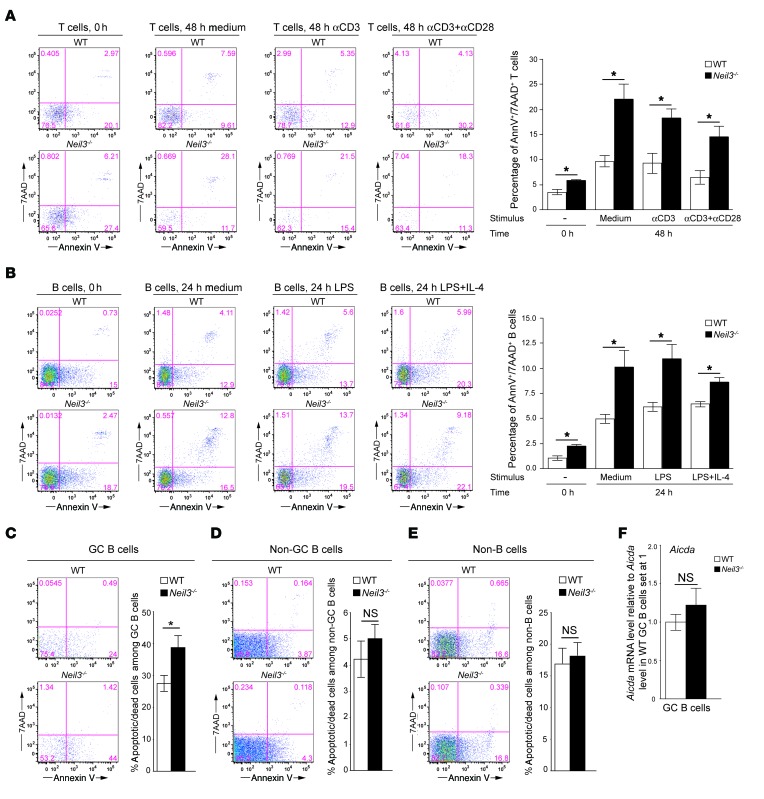
Figure 9. Percentages of apoptotic/dead T, B, and GC B cells and Aicda mRNA levels in GC B cells from Neil3–/– mice.
(A and B) Representative annexin V and 7AAD staining and quantitative analysis of the percentages of annexin V+7AAD+ cells among splenic CD4+ T cells (A) and B220+ B cells (B) freshly isolated from Neil3–/– mice and WT controls (0 hours) and after in vitro T cell stimulation with anti–CD3 ± CD28 for 48 hours or B cell stimulation with LPS ± IL-4 for 24 hours. (C–E) Representative annexin V and 7AAD staining and quantitative analysis of the percentages of annexin V+ cells among B220+Fas+GL7+ GC B cells (C), B220+Fas–GL7– non–GC B cells (D), and B220– non–B cells (E) from PP of Neil3–/– mice and WT controls. (F) Aicda mRNA levels in sorted GC B cells from Neil3–/– mice and WT controls expressed relative to the average levels of Aicda mRNA in WT GC B cells set at 1. Columns and bars represent mean ± SEM of 3 mice per group for A–B, and F, or 8 mice per group for C–E. P values were obtained by 2-tailed Student’s t test. *P < 0.05. NS, not significant.

