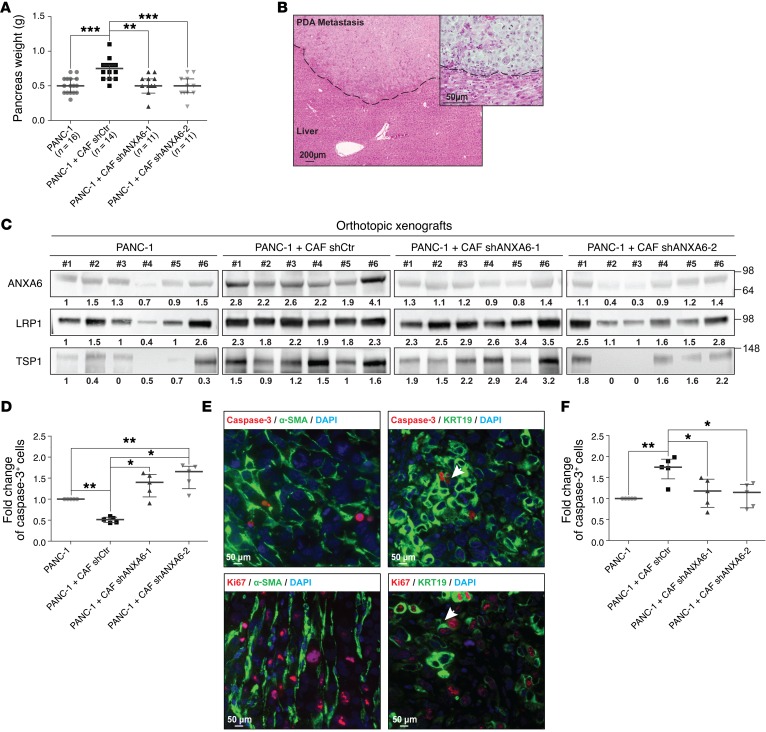
Figure 4. Impact of ANXA6 loss on PDA aggressiveness in vivo.
(A) Expression of ANXA6 in CAFs promotes pancreatic tumor growth of PANC-1. Two months after injection of cells, mice were euthanized, and cancerous pancreas dissected and weighed (median ± interquartile range; for mice injected with PANC-1, n = 16; for mice injected with PANC-1 + CAF shCtr, n = 14; for mice injected with PANC-1 + CAF shANXA6-1, n = 11; for mice injected with PANC-1 + CAF shANXA6-2, n = 11). **P < 0.01, ***P < 0.001, Mann-Whitney U test. (B) Representative micrograph of H&E-stained liver from mice coinjected with PANC-1 and shCtr CAFs0029. Dashed line delimits healthy liver (bottom) from PDA metastasis (top). (C) Western blot of the indicated proteins in lysates established from 6 orthotopic xenografts from each group obtained in A. Amido black level was used for normalization, and quantifications noted below are expressed as fold increase compared with mice #1 injected with PANC-1 alone. (D) Caspase-3+ cells numbered by immunochemistry on orthotopic xenografts obtained in A (median ± interquartile range, n = 3). *P < 0.05, **P < 0.01, Mann-Whitney U test. (E) Representative micrographs of dual immunofluorescence using caspase-3 or Ki67 staining with α-SMA or KRT19 on slides made up from orthotopic xenografts obtained by coinjection of PANC-1 and shCtr CAFs. Data are representative of 3 independent experiments. (F) Ki67+ cells numbered by immunochemistry on orthotopic xenografts obtained in A (median ± interquartile range, n = 3). *P < 0.05, **P < 0.01, Mann-Whitney U test.

