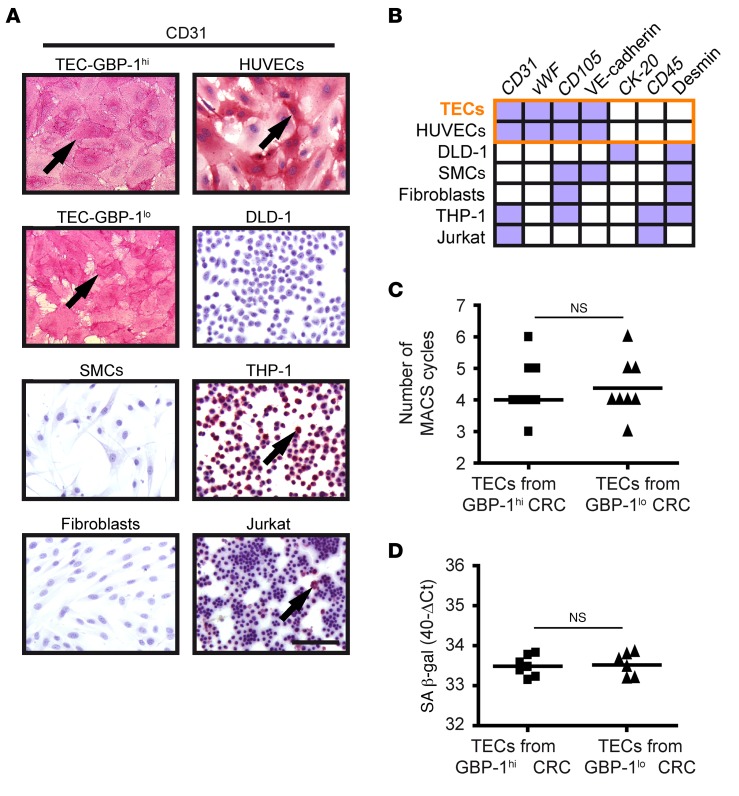
Figure 2. TECs isolated from CRC with an angiostatic Th1-TME and control-TME are pure and show an EC phenotype.
(A) The purity of TEC cultures was determined by CD31 immunocytochemical staining. CD31-positive control cells (pink, arrows) were primary ECs (HUVECs), monocytes (THP-1), and T cells (Jurkat); CD31-negative control cells were CRC cells (DLD-1), primary SMCs, and primary fibroblasts. Scale bar: 100 μm. (B) Expression of a panel of cell type–specific markers was analyzed in isolated TECs after CD31 staining (see A) and indicated high purity compared with control cells. All TECs showed expression of markers (purple boxes) identical to that of HUVECs (orange frame). CK-20, CD45, and desmin were continuously negative (white boxes), excluding contamination with CRC tumor cells, SMCs, fibroblasts, monocytes, and T cells. Detailed values are provided in Supplemental Table 2. (C) Dot plot shows the number of MACS cycles required to obtain pure TEC cultures. (D) Expression of SA β-gal was determined by RT-qPCR in the isolated TEC cultures. Expression levels are indicated as 40-ΔCt values. SA β-gal expression could not be determined in 3 TEC cultures due to consumption of the respective RNAs by transcriptome and purity analyses. (C and D) Statistical significance was determined by Student’s t test. Mean values are indicated by line; NS, not significant.

