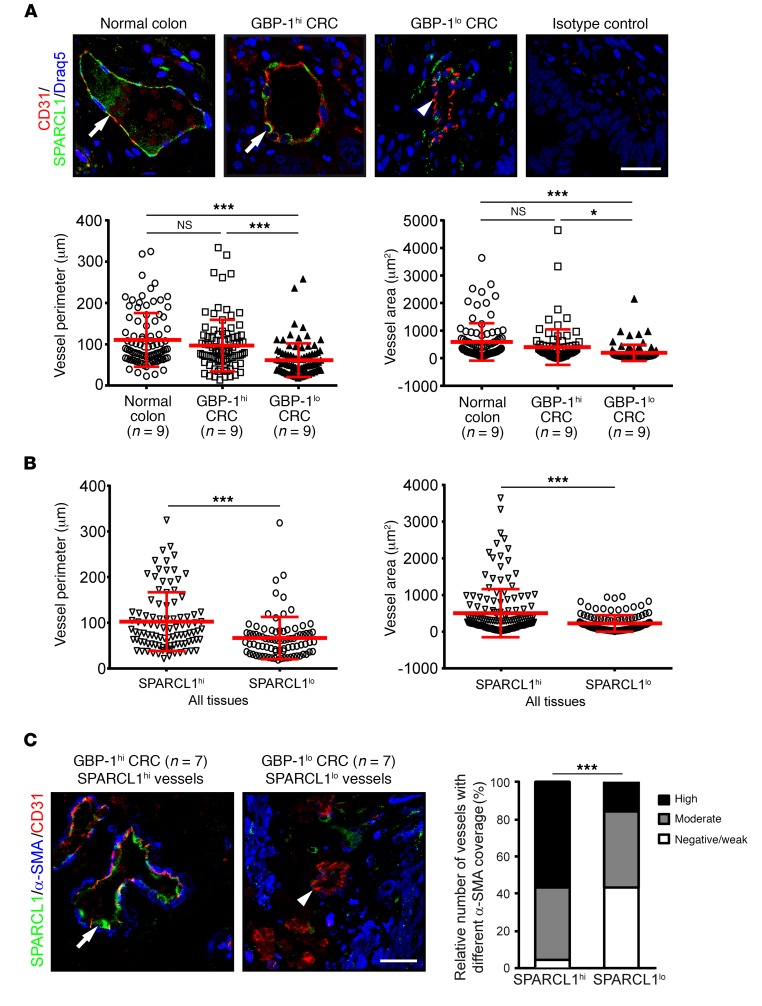
Figure 7. SPARCL1 expression is associated with mature vessels.
(A) Expression of SPARCL1 (green) and CD31 (red) was detected by immunofluorescence costaining in normal colon, and GBP-1hi and GBP-1lo CRC (n = 9 each). The combined isotype antibodies were used for the control staining. Tissues were counterstained with DRAQ5 (Cell Signaling Technology; blue). Colocalization is indicated by arrows. CD31 expression only is indicated by an arrowhead. Scale bar: 25 μm. Vessel perimeters and areas were quantitatively determined for all the stained vessels (n = 270; 10 vessels/patient) and are depicted as dot plots (red bars indicate the mean values and SD). (B) The vessel perimeters and areas as quantified in A in relation to vessels with high and low SPARCL1 expression for all tissues. (C) Immunofluorescence costaining of SPARCL1 (green), CD31 (red), and α-SMA (blue). Scale bar: 25 μm. α-SMA–positive mural cell coverage was categorized as negative/weak, moderate, or high for 296 vessels from 30 patients, and the relative size of each category is given for SPARCL1hi and SPARCL1lo vessels. The relative amount of coverage is depicted for vessels with SPARCL1 expression in ECs only (n = 205). The relative number of vessels with different alpha-SMA coverage (%) is indicated by different gray tones. (A and B) Representative experiment of 2 independent experiments is depicted. *P < 0.05 and ***P < 0.001, by ANOVA, with Levene and Games-Howell (unequal variance) tests (A), Student’s t test (B), and χ2 test (C).

