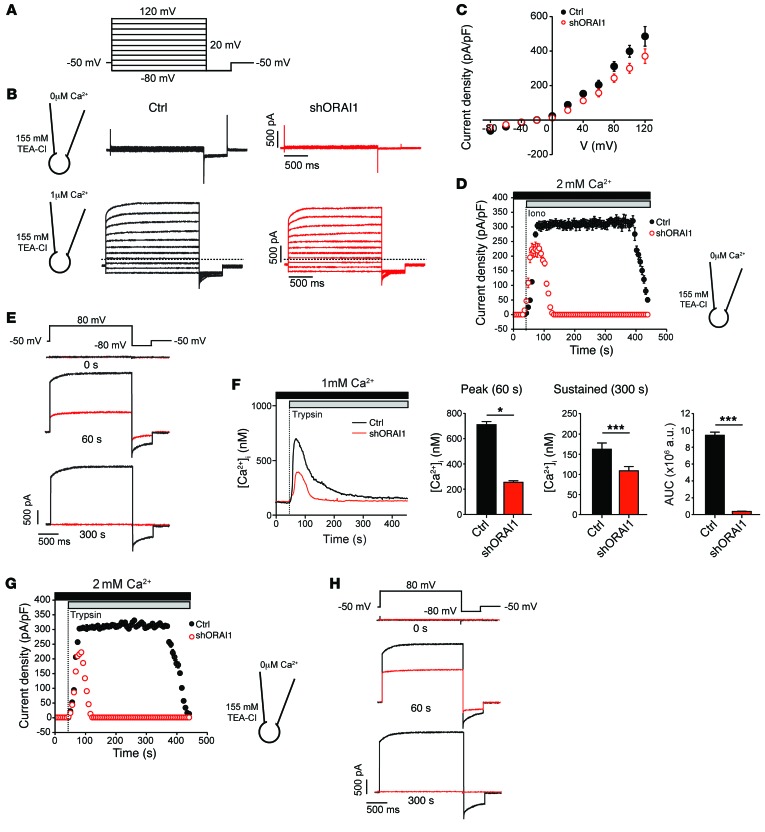
Figure 6. SOCE activates Ca2+-dependent Cl– channels (CaCCs) in human sweat gland cells.
NCL-SG3 cells were transduced with shORAI1 (red) or left untransduced (Ctrl, black) and Cl– currents measured by whole-cell patch-clamp. (A) Currents were elicited by 20-mV steps from –80 mV to 120 mV (from a holding potential of –50 mV) followed by a 0.5-second hyperpolarizing step to –80 mV. (B) Representative current traces recorded in individual Ctrl and shORAI1-transduced NCL-SG3 cells with 0 μM Ca2+ (top) or 1 μM Ca2+ (bottom) present in the patch pipette. Dotted lines indicate the zero-current level. (C) Current density as a function of voltage at the end of each test pulse from experiments shown in B (mean ± SEM, n = 5 per cell line). The reversal potential of the current is close to the equilibrium potential of Cl– (ECl ~ –24 mV). (D) Current densities in NCL-SG3 cells stimulated with 1 μM ionomycin (Iono). Currents were elicited by consecutive 2-second voltage steps to 80 mV, followed by a 0.5-second hyperpolarizing step to –80 mV (mean ± SEM, n = 5 cells per cell line). (E) Representative Cl– current traces extracted at 0, 60 and 300 seconds from the experiment in D. (F) Representative [Ca2+]i traces from NCL-SG3 cells stimulated with 10 μM trypsin (left) and quantitation of [Ca2+]i at 60 seconds (peak) and 300 seconds (sustained phase). The AUC was integrated between 50 and 300 seconds (mean ± SEM of 3 independent experiments, n = 15 cells analyzed per experiment). Statistical significance was determined using a 2-tailed Student’s t test. *P < 0.05, ***P < 0.001. (G) Current densities were recorded in NCL-SG3 cells stimulated with 10 μM trypsin using an identical pulse protocol to E. (mean ± SEM, n = 5). (H) Representative Cl– current traces extracted at 0, 60 and 300 seconds from the experiment shown in G. TEA-Cl, tetraethylammonium chloride.

