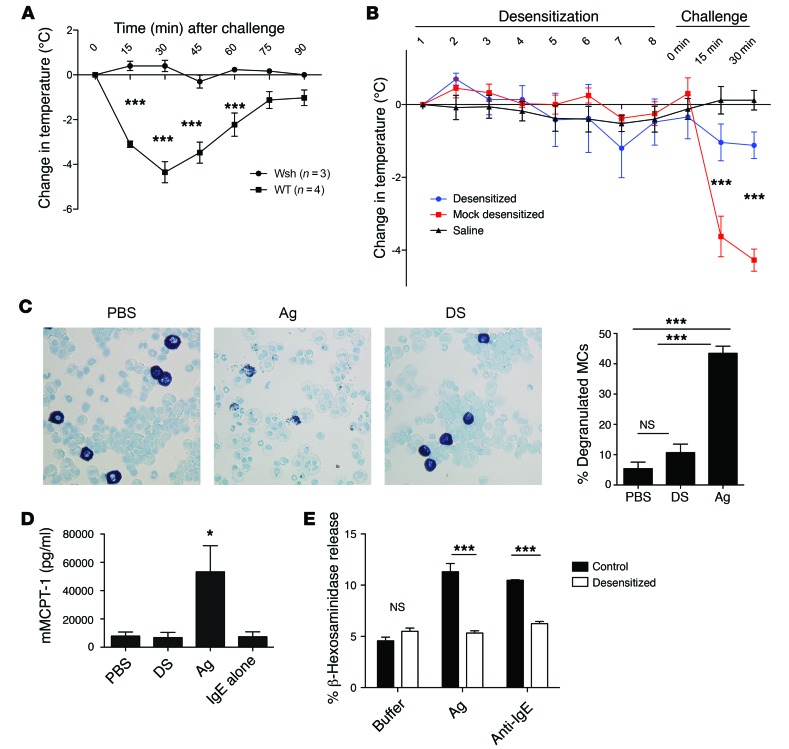
Figure 1. In vivo and in vitro models of desensitization.
(A–D) Mice were sensitized i.p. with 10 μg IgE and challenged i.p. with 500 μg TNP-OVA. Temperatures were measured rectally and expressed as change in initial temperature. (A) MC-deficient Wsh mice and WT mice were challenged with Ag and monitored for 90 minutes (n = 3–4). (B) Mice were orally desensitized or mock treated for 8 doses, each spaced 30 minutes apart. Thirty minutes after the last dose, mice were challenged with Ag and rectal temperatures recorded every 15 minutes. Mice were given saline throughout (n = 5). (C) Peritoneal lavage was obtained at the end of desensitization or equivalent period of i.p. Ag challenge or PBS treatment (n = 4–5 per group). Lavage was cytospun and stained with toluidine blue, and the percentage of degranulated MCs was counted in 5 random fields per cytospin. Representative images at ×40 magnification are shown. (D) Mice were bled at the end of desensitization or Ag challenge as in B and serum analyzed via ELISA for MCPT-1 (n = 5). 5 × 10⁵ IgE-sensitized BMMCs in triplicate were desensitized or control treated, then challenged with buffer, 10 ng/ml Ag, or 0.5 μg/ml anti-IgE. β-Hexosaminidase release was measured and expressed as a percentage of total. Data were analyzed via repeated-measures ANOVA (A and B), 1-way ANOVA (C and D), or 2-way ANOVA (E). Error bars represent SEM. *P < 0.05, ***P < 0.001.

