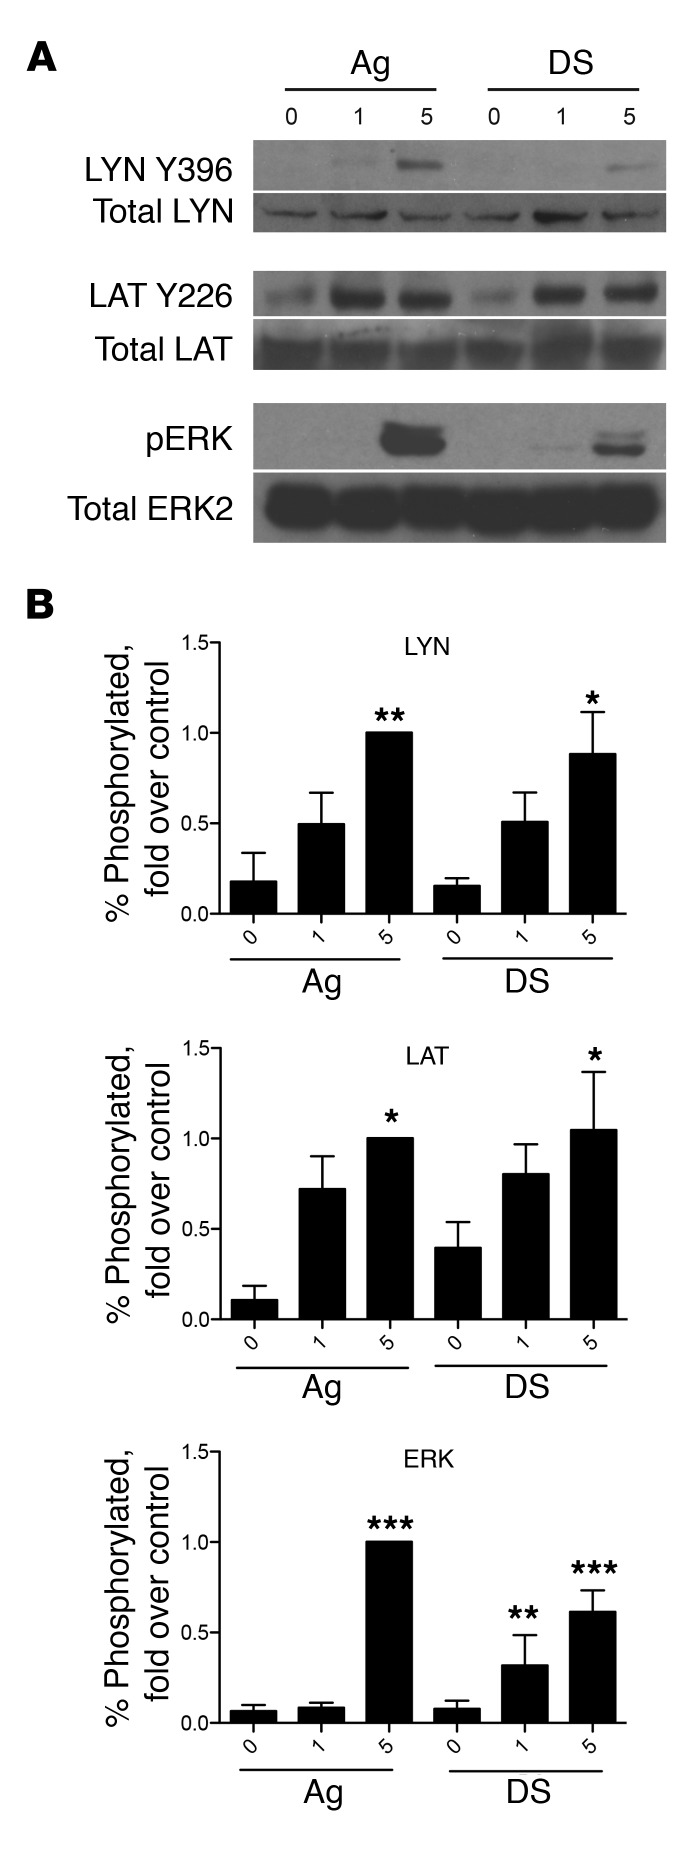
Figure 3. Desensitized cells have signaling responses to Ag.
(A) 2 × 10⁶ BMMCs per sample were sensitized with IgE, desensitized (DS), or left untreated (Ag) before challenge with Ag for 0, 1, or 5 minutes. Cells were directly lysed in 4× Laemmli buffer for SDS-PAGE and immunoblotted for phospho- and total LYN, LAT, and ERK. Representative blots from 4 experiments are shown. (B) Densitometry was performed on blots from 4–5 experiments. Data were expressed as percentage of phosphorylated protein compared with total, then normalized to the positive control (5 minutes Ag activation). Data were analyzed via 1-way ANOVA and represent SEM. *P < 0.05, **P < 0.01, ***P < 0.001 compared with IgE group.

