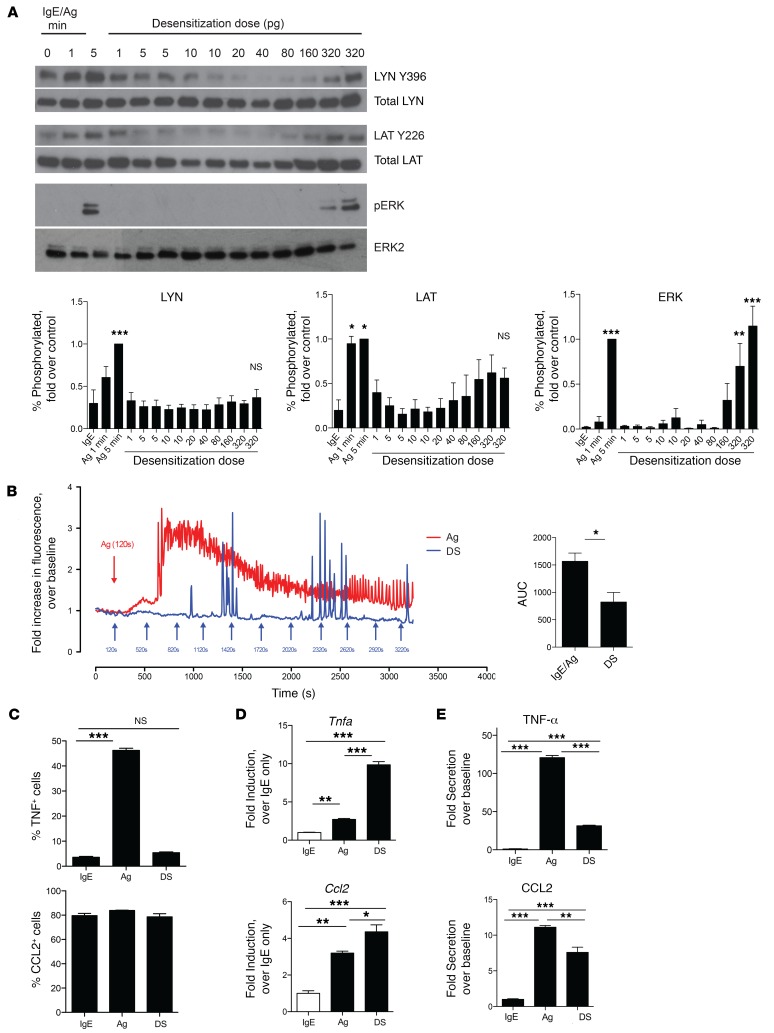
Figure 5. Signal transduction but no calcium mobilization during RDS.
(A) 2 × 10⁶ BMMCs per sample were sensitized with IgE before Ag challenge for 0, 1, or 5 minutes (first 3 lanes) or desensitized (lanes 4–14), with samples collected 1 minute after each dose was added. Samples were immunoblotted for phospho- and total LYN, LAT, and ERK. Blots are representative of at least 3 experiments. For densitometry, data were expressed as percentage of phosphorylated protein compared with total, then normalized to the positive control (5 minutes Ag). Data were analyzed via 1-way ANOVA with comparisons with IgE (Dunnett’s post-test). (B) BMMCs were adhered to Cell-Tak–coated (Corning) glass-bottomed plates for calcium imaging. Cells were stimulated with Ag or desensitized (DS), with successive doses added every 5 minutes (arrows). AUC analyses were averaged from 4–5 independent experiments. (C–E) 5 × 10⁵ IgE-sensitized BMMCs per sample in triplicate were desensitized (DS), antigen challenged (Ag), or untreated (IgE). (C) BMMCs were incubated with brefeldin A for 8 hours before intracellular staining for FACS. (D) RNA was isolated from cell pellets for cDNA preparation. Quantitative RT-PCR was performed using primers for Ccl2 and Tnfa and normalized to Actb expression. (E) Cell supernatants after 24 hours were analyzed for CCL2 and TNF-α secretion. Data were expressed as fold over IgE-only controls. Data were analyzed via 1-way ANOVA (A and C–E) or Student’s t test (B). Data represent SEM. *P < 0.05, **P < 0.01, ***P < 0.001.

