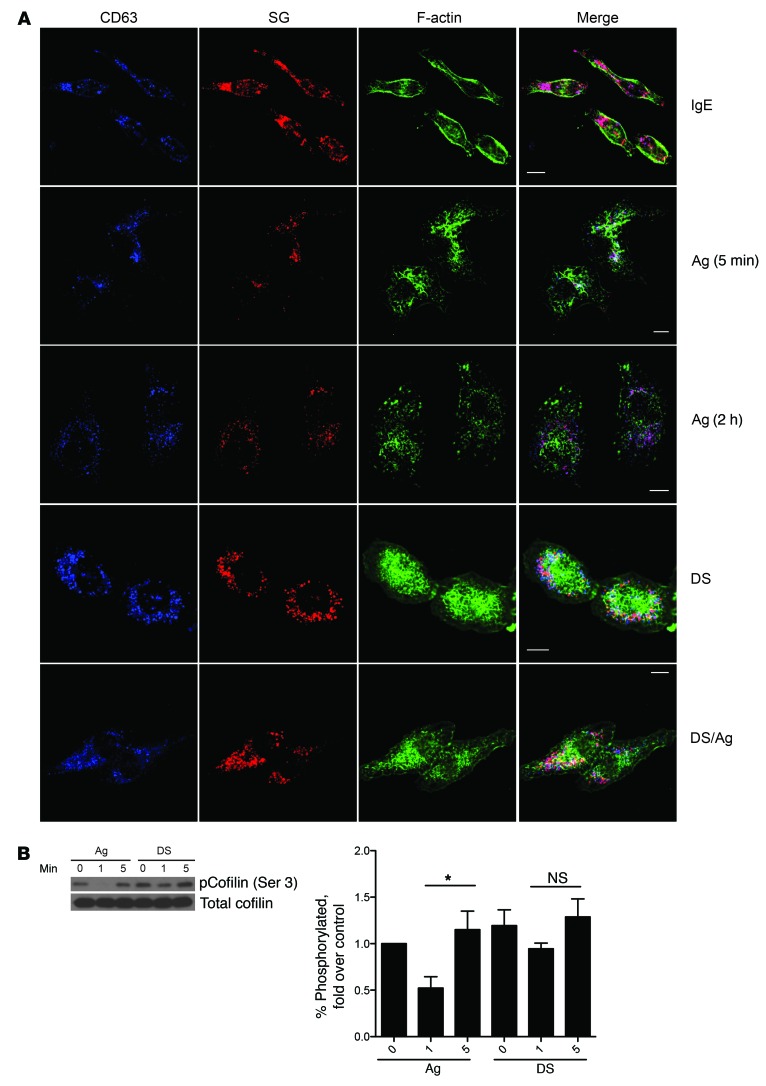
Figure 6. Distinct actin reorganization in desensitized cells.
(A) Serglycin (SG)–mCherry (red) RBL-2H3 cells were plated on coverslips before desensitization and/or challenge with Ag for 5 minutes followed by fixation and staining for CD63 (blue) and F-actin (green). Images are representative of at least 3 independent experiments. Scale bars: 10 μm. (B) 2 × 10⁶ BMMCs per sample were desensitized (DS) or untreated (Ag) before challenge with Ag for 0, 1, or 5 minutes. Lysates were immunoblotted for phosphorylated and total cofilin. Blots represent at least 4 experiments. Densitometry data were expressed as percentage phosphorylated protein compared with total, then normalized to control (IgE). Data were analyzed via 1-way ANOVA. Data represent SEM. *P < 0.05.

