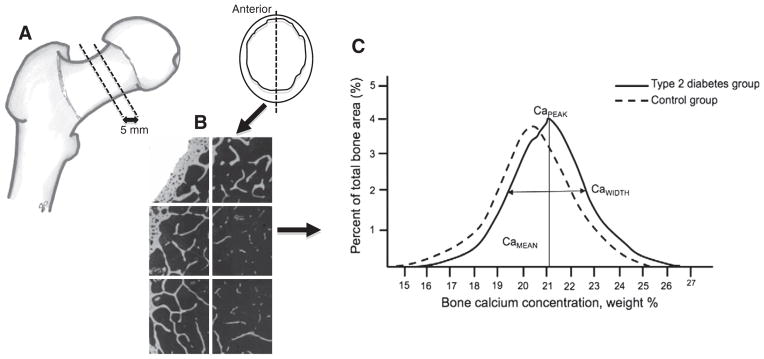
Fig. 1.
A. Schematic diagram representing a proximal femur and a typical section of femoral neck used for qBEI (anterior section). B. Example of the frames captured of a bone sample using qBEI and BMDD outcomes. C. Schematic of a BMDD histogram and outcome measurements for adults with type 2 diabetes and controls, including the weighted mean calcium concentration (CaMEAN), the most frequently occurring calcium concentration (CaPEAK) and full width at half maximum of the histogram peak reflecting mineralization heterogeneity (CaWIDTH).

