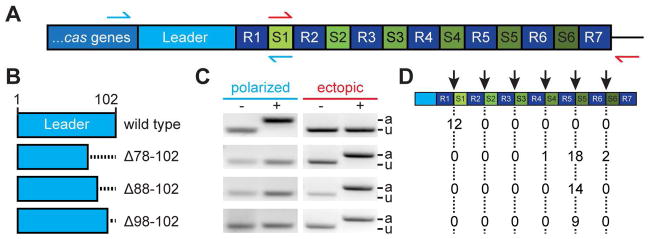
Figure 1. Deletions within the leader sequence result in ectopic spacer integration.
(A) Type II-A CRISPR locus from Streptococcus pyogenes SF370. A 102 bp leader sequence separates the cas genes from the CRISPR array, which contains seven repeats (R1-7) flanking six spacers (spc1-6). Red and green arrows indicate primers used to detect spacer integration at the leader-end (polarized) or at the middle of the array (ectopic), respectively.
(B) Deletions of the leader sequence analyzed in this study.
(C) PCR-based detection of polarized or ectopic spacer integration using the primers described in (A). DNA for PCR was extracted from colonies obtained from cultures incubated with (+) or without (−) phage ϕNM4γ4. PCR products were separated by agarose gel electrophoresis and stained with ethidium bromide. A gel image representative of many PCRs is shown. The size of the PCR product reflects the presence (a, “adapted”) or absence (u, “unadapted”) of integration of new spacers.
(D) Position of ectopic spacer integration events (marked by the red arrow) after Sanger sequencing of PCR products obtained in (C) for cells infected with phage carrying different leader sequence deletions. Numbers in table represent totals from three replicates.

