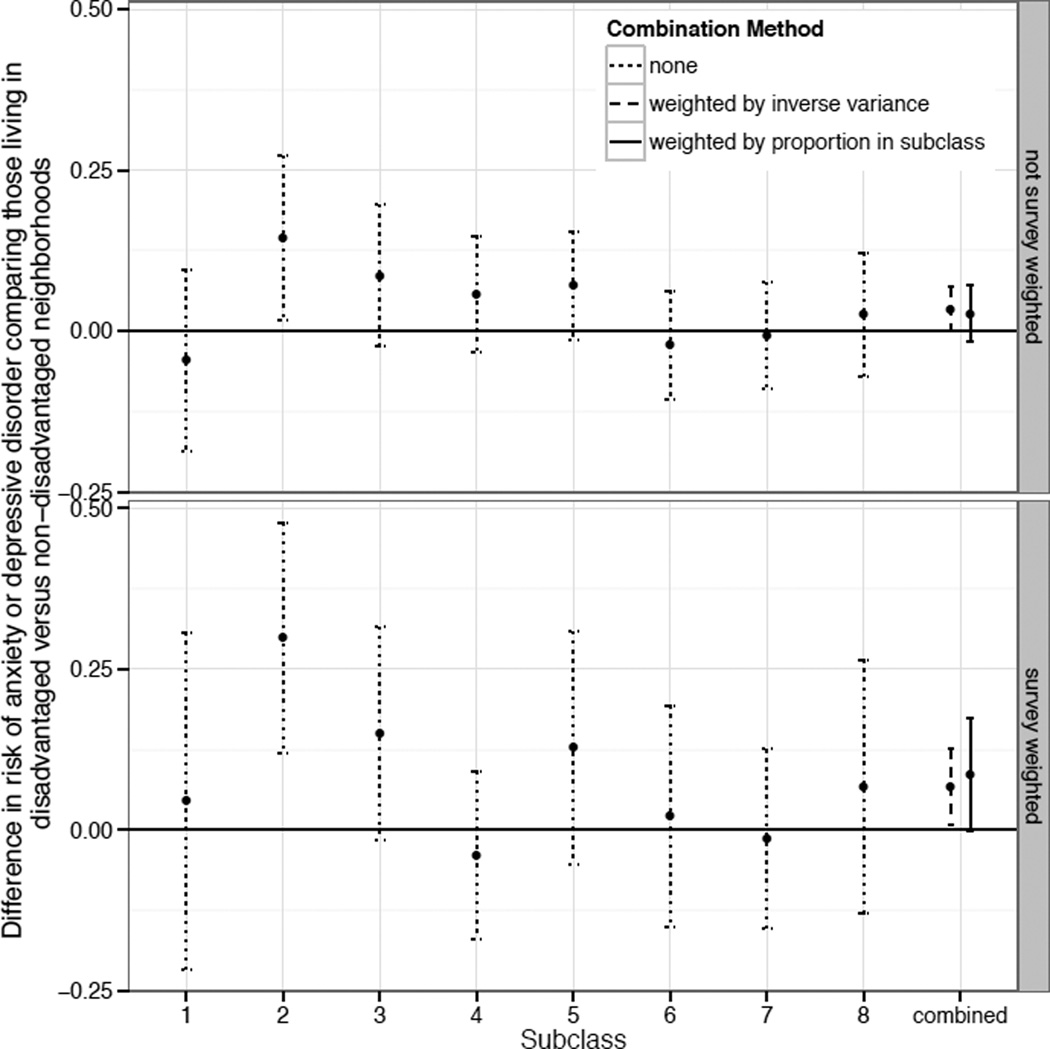
Figure 1.
Illustrative example: subclass-specific and overall ATEs estimated without (top panel) and without (bottom panel) survey weights. Overall ATEs compares combining subclasses by weighting by the proportion in each subclass versus weighting by the inverse variance. Each ATE is the estimated difference in risk of anxiety or depressive disorder comparing those living in disadvantaged versus non-disadvantaged neighborhoods.

