
Fig. 2.
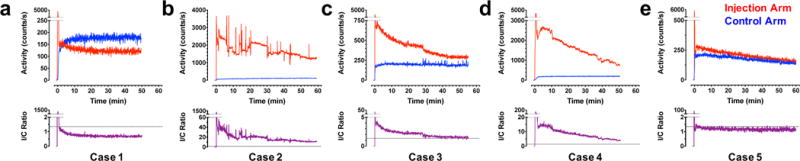
Time activity curves (TACs) from sensors placed over the injection arm (red) were normalized to those obtained on the control arm (blue) to determine the I/C ratio (purple) in a patient with no visible infiltration (a) and patients with severe (b), moderate that resolves to small (c), and severe that resolves to moderate (d) infiltration. PET data corresponding to each of these cases are found in Fig. 3. One patient (e) had a low activity spot of FDG, visible on PET (Fig. 3e), but TAC data were inconclusive due to sensor distance from this spot. Note the differential ordinate scaling; see Supplemental Figure 1 for TAC data from all 10 scans.