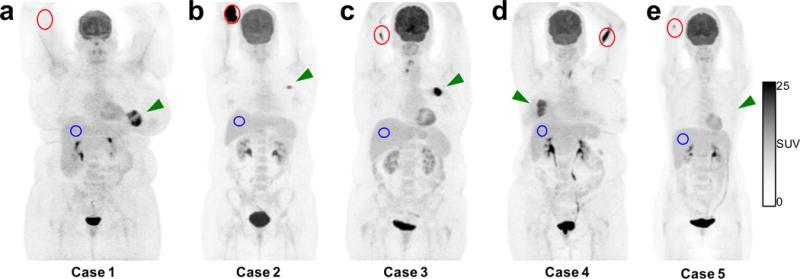
Fig. 3.

Maximum intensity projections from PET images, corresponding to the sensor time activity curves (TACs) in Fig. 2, illustrate the antecubital injection site (red), hepatic control site (blue), and tumour (green arrow) in a patient with no visible infiltration (a) and patients with severe (b), small (c), and moderate (d) infiltration. One patient (e) had a low activity spot of FDG that was not detected by the sensor, but TAC data (Fig. 2e) were inconclusive due to sensor distance to this spot.
