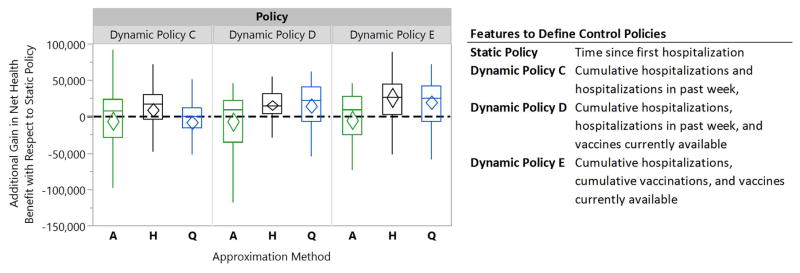
Figure 7. Box plots comparing the relative performance of dynamic school-closure and vaccine prioritization policies to a static policy for a willingness-to-pay of $300,000 for averting one life-year loss.
The diamonds represent 95% confidence intervals for the mean of paired performance differences using 50 simulation runs. The A-, H-, and Q-Approximation methods use, respectively, 1, 2n, and 2n regression models to characterize a dynamic policy when n interventions can be turned on or off (see §3.2.3 for details).

