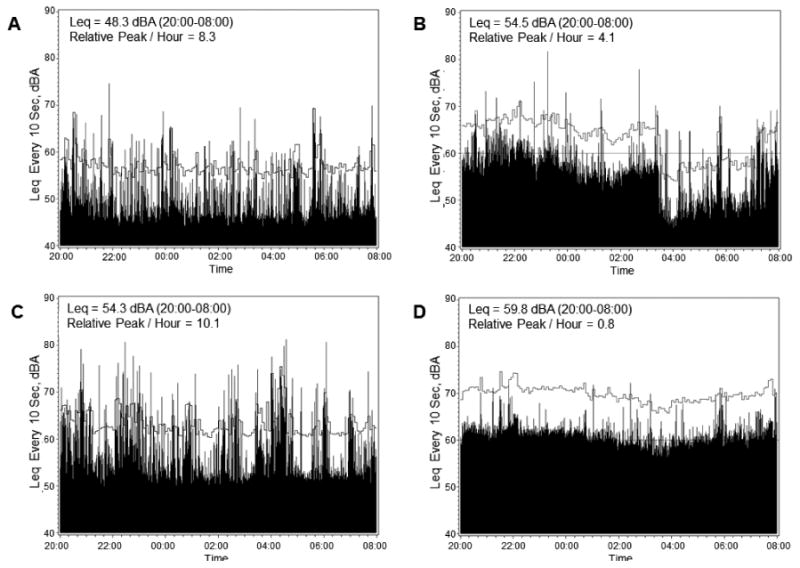
Figure 3.

Single patient sound plots across the 20:00 to 08:00 overnight period. Leq and relative peaks are indicated in the upper left of each panel. Absolute dBA value every 10 seconds is indicated by black bars. Clock time is on the x-axis and decibels on the y-axis. Local mean is indicated by the horizontal grey line. Relative peaks are any values (black bars) that cross the local mean (horizontal grey line). Clinical vignettes with age rounded to the nearest decade are as follows: A. 80 year old with a history of stroke, atrial fibrillation and colon cancer who was admitted to the MICU for urosepsis. B. 50 year old with a history of end stage renal disease and peripheral vascular disease who was admitted to the MICU for sepsis related to a skin wound. C. 50 year old with end stage liver disease from hepatitis C virus who was admitted to the MICU for poor mental status in the setting of hepatic encephalopathy. D. 70 year old with chronic obstructive pulmonary disease and acute myeloid leukemia who was admitted to the MICU for hypoxemia in the setting of blast crisis.
