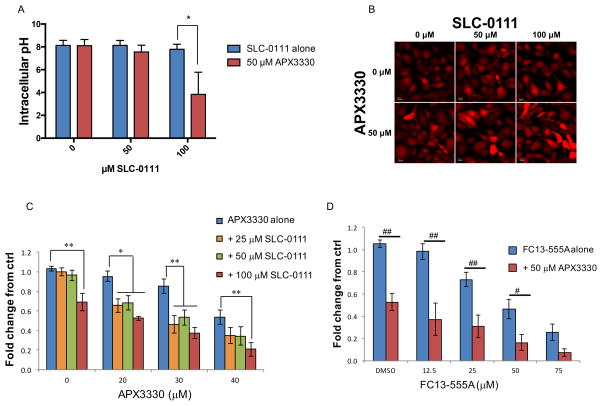
Figure 4. Dual-targeting of CA9 and APE1/Ref-1 acidifies PDAC cells and inhibits cell viability under hypoxia.
A. Panc10.05 cells were treated with APX3330 and SLC-0111 and exposed to hypoxia (0.2% O2) for 48 hrs prior to analysis of intracellular pH (Avg ± SE, n=3). Representative images from pH experiments are shown in B. C–D. Viability assay of Pa02C cells treated with the indicated concentrations of APX3330 and CA9 inhibitors, SLC-0111 or FC13-555A and exposed to hypoxia (0.2%) for six days (Avg ± SE, n=6). Fold change refers to the comparison of each data point to the fluorescence of untreated tumor cells. *p<0.05 & **p<0.01 (Dunnett’s Multiple Comparisons Test); #p<0.05 & ##p<0.01 (Sidak’s Multiple Comparisons Test). Additionally, differences in nonlinear regression curves between treatment groups were confirmed using extra-sum-of-squares F tests followed by Bonferroni Corrections in each experiment (p<0.05 for all dual-treatment curves vs. single-agent curves).

