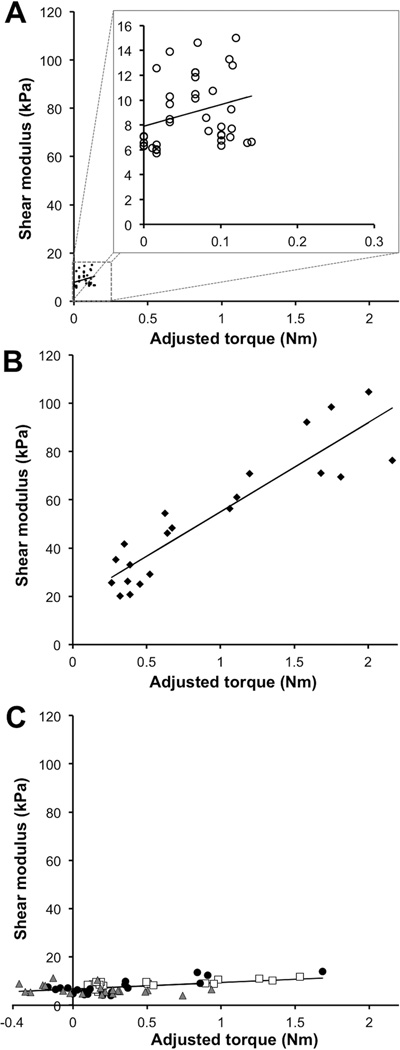
Figure 5.
Stiffness (shear moduli) and velocity-dependent torque during all 40°/s trials. Black line indicates generalized linear model regression line obtained from generalized estimating equations analysis. A) controls, with minimal torque and shear moduli responses; y = 17.394x + 7.898; R2 = 0.103; B) S1, with strong torque and shear moduli responses to passive extension; y = 36.856x + 18.197; R2 = 0.829; C) S6, S3, S7, with strong torque response and minimal shear moduli responses; y = 2.712x + 6.676; R2 = 0.181.

