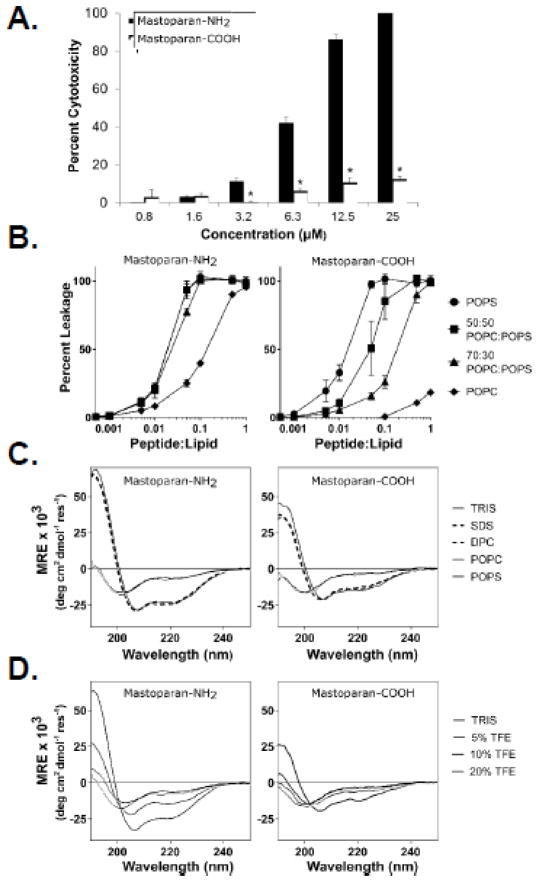
Figure 4. C-terminal amidation enhances Mastoparan potency.
(A) Jurkat T leukemia cells were cultured in the presence or absence of the indicated concentrations of Mastoparan-NH2 or Mastoparan-COOH for 24 h, at which point cytotoxicity was assessed using the MTT assay. Data shown represent the mean of 3 independent experiments ± SEM and are significant by the Student’s t test (* denotes p < 0.05, in comparison to Mastoparan-NH2-induced cytotoxicity). (B) Calcein encapsulated large unilamellar vesicles (LUVs) of varying composition were incubated with either Mastoparan-NH2 or Mastoparan-COOH at the indicated peptide:lipid ratios for 20 min. Mastoparan-mediated membrane leakage was assessed by measuring the release of calcein dye from LUVs after 20 minutes incubation with the peptide. Data shown represent the mean of 3 independent experiments ± SD. (C) Structural characterization of Mastoparan-NH2 and Mastoparan-COOH by CD spectroscopy. Spectra were acquired on 25 μM peptide samples in 10mM TRIS buffer (pH 7.4), as well as in the presence of 25 mM SDS or 10 mM DPC micelles or SUVs composed of either POPC or POPS phospholipids (lipid concentration of 250 μM). (D) The folding propensity of each peptide was also evaluated by recording CD spectra in the presence of increasing concentrations of TFE (% v/v).

