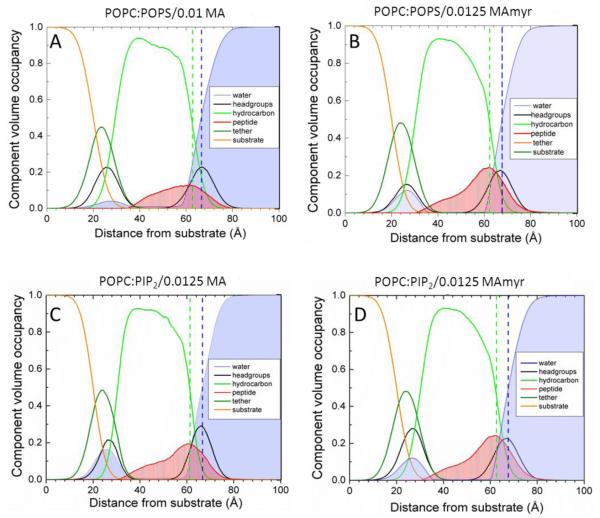
Figure 9.
Scattering density profiles obtained from neutron reflectivity. A. POPC/POPS (60:40 mole ratio)/0.01 MA31, B. POPC/POPS (60:40)/0.0125 MA31myr, C. POPC/PIP2 (90:10)/0.0125 MA31, D. POPC/PIP2 (90:10)/0.0125 MA31myr. Bilayer components are shown in the legends; Gibbs dividing surfaces HC (green dashed line) and water (blue dashed line) are shown.

