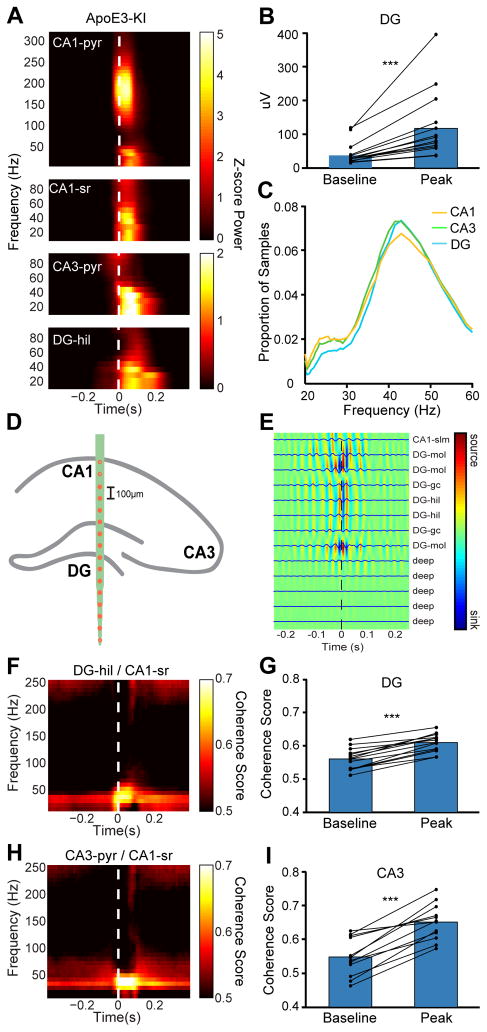
Figure 3. Transient slow gamma oscillation during SWRs in CA1, CA3, and DG of the hippocampus in apoE3-KI mice.
(A) Representative examples of SWR-triggered spectrograms from CA1 pyramidal cell layer (CA1-pyr), CA1 stratum radiatum (CA1-sr), CA3 pyramidal cell layer (CA3-pyr), and DG hilus (DG-hil) in an apoE3-KI mouse. White dashed line represents threshold crossing for SWR detection.
(B) Average increase in slow gamma power from baseline (350 ms before SWR detection) to peak of SWR in DG for all apoE3-KI mice (paired t test; t(13) = 4.348, n = 14).
(C) Distribution of instantaneous frequency measurements in all three hippocampal subregions.
(D) Schematic representation of site location in an apoE3-KI mouse receiving a probe with 100-μm site spacing. Filled circles indicate sites used for CSD analysis.
(E) SWR-triggered CSD profile indicates distinct regions of slow gamma activity in DG region. Color and traces represent averaged (traces) and smoothed (color) CSD values based on LFP signal filtered for slow gamma activity (30–50 Hz), averaged across SWRs. Note phase reversal across granule cell layers, indicating local origin of activity. Sites include CA1 stratum lacunosum-moleculare (CA1-slm), DG molecular layer (DG-mol), DG granule cell layer (DG-gc), and DG hilus (DG-hil). Deep sites are located outside the hippocampal formation.
(F) SWR-triggered coherogram between DG hilus and CA1 stratum radiatum.
(G) Quantification of coherence between DG and CA1 stratum radiatum at baseline (400–300 ms before SWR detection) and SWR peak (0–100 ms after SWR detection) for all apoE3-KI mice (paired t test; t(13) = 10.86, n = 14).
(H) SWR-triggered coherogram between CA3 pyramidal cell layer and CA1 stratum radiatum.
(I) Quantification of coherence between CA3 and CA1 stratum radiatum at baseline (400–300 ms before SWR detection) and SWR peak (0–100 ms after SWR detection) for all apoE3-KI mice (paired t test; t(13) = 8.082, n = 14).
***P < 0.001. See also Figure S2

