Figure 5.
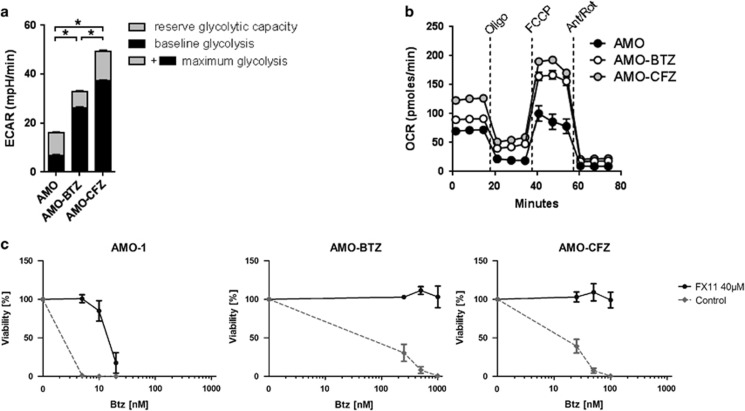
Role of glycolysis in proteasome inhibitor resistance. (a, b) The AMO-1 cell line and its derivatives adapted to bortezomib (AMO-BTZ) and carfilzomib (AMO-CFZ) were seeded in a 96-well XF Extracellular Flux Analyzer to simultaneously quantify (a) extracellular acidification rates (ECAR) and (b) oxygen consumption rates (OCR) as measures of glycolysis and mitochondrial respiration, respectively. (a) Real-time baseline glycolytic rate of the different cell lines was determined by subtracting the difference in levels in ECAR before and after injection of 10 mm glucose. Reserve glycolytic capacity was calculated by subtracting baseline ECAR readings from ECAR values following treatment with ETC blockers antimycin A/rotenone. (b) Real-time OCR was determined during sequential treatments with oligomycin (ATP-synthase inhibitor), FCCP (uncoupler) and antimycin-A/rotenone (ETC inhibitors). Maximum mitochondrial respiration is reached following treatment with FCCP that leads to uncoupling of the mitochondria. Data represent means±s.e.m. of eight replicates. One representative experiment of three is shown. (c) The AMO-1 cell line and its derivatives adapted to bortezomib (AMO-BTZ) and carfilzomib (AMO-CFZ) have been cultured in the presence of 40 μm FX11, and bortezomib (Btz) for 5 days, and viability was assessed by MTS (3-(4,5-dimethylthiazol-2-yl)-5-(3-carboxymethoxyphenyl)-2-(4-sulfophenyl)-2H-tetrazolium) test. Absorbance values of treated cells were normalized to the controls without specific inhibitors. Data are presented as a mean±s.d. of three independent replicates.

