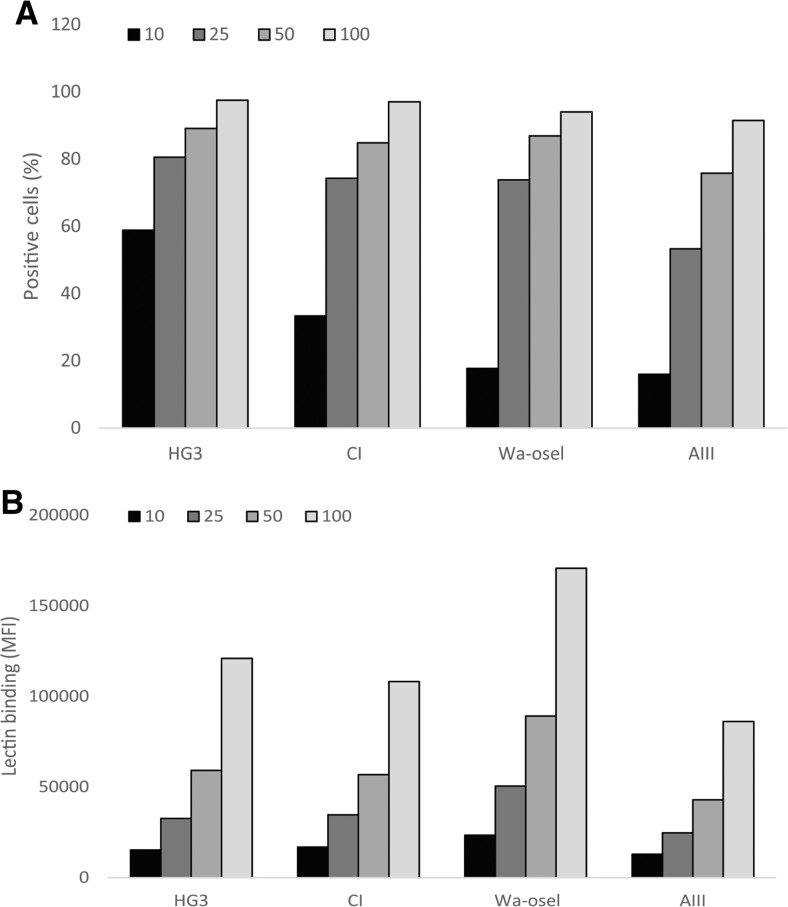
Fig. 3.
Lectin binding on the four CLL cell lines. Results of HG3, CI, Wa-osel, and AIII cells stained with different concentrations of lectin-FITC. Flow cytometry results present a the positive cells for lectin binding and b the MFI of the lectin binding. One representative experiment out of two performed is shown

