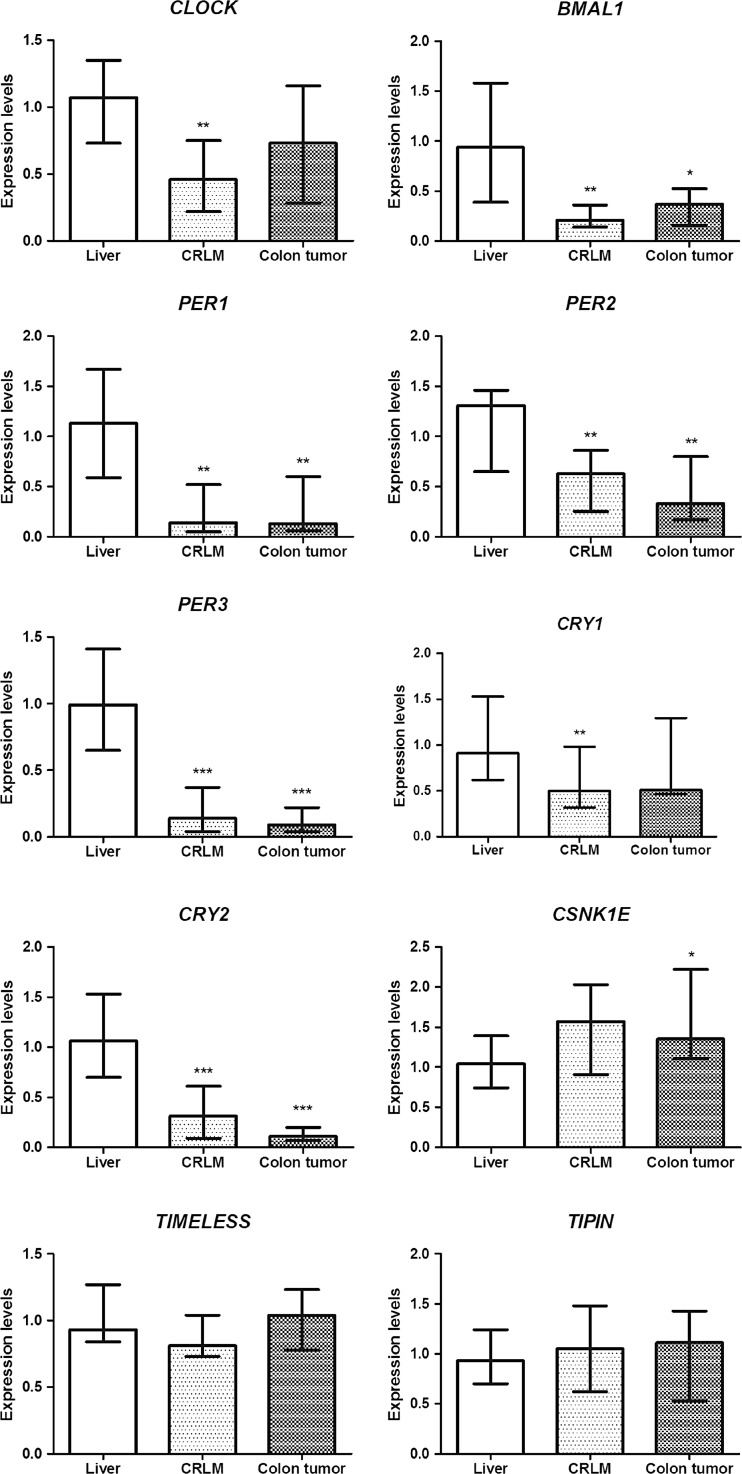
Fig. 1.
mRNA expression levels of clock and clock-controlled genes in the liver, colorectal liver metastases (CRLM), and colon tumor. The relative mRNA expression of each gene of interest was normalized to glutaraldehyde-3-phosphate dehydrogenase (GAPDH). ΔCt values were normalized to the average ΔCt of the normal liver tissue. For each gene, boxes show the median with the interquartile range (IQR = Q3−Q1). Asterisks indicate significance of the difference in expression of each gene in the liver as compared to CRLM and CRC as assessed by the Wilcoxon signed-rank test (*p < 0.05, **p < 0.01, ***p < 0.001)

