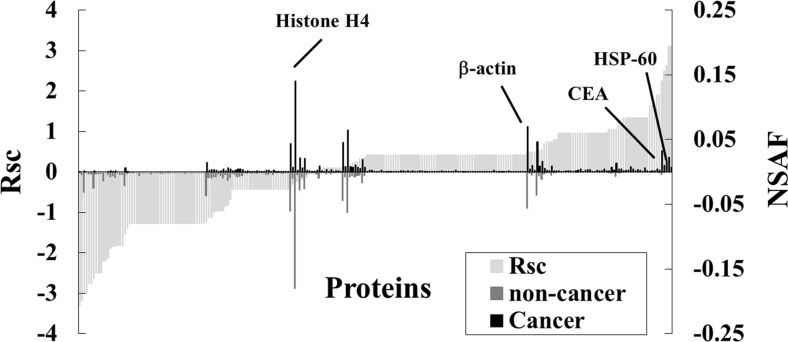
Fig. 3.
Semiquantitative comparison of proteins identified in FFPE colon tissue. Rsc and normalized spectral abundance factor (NSAF) values calculated for the proteins identified (x-axis). Comparison of protein expression in cancer versus non-cancer tissue. Proteins highly expressed in either cancer or non-cancer regions were plotted near the right or left side of the x-axis

