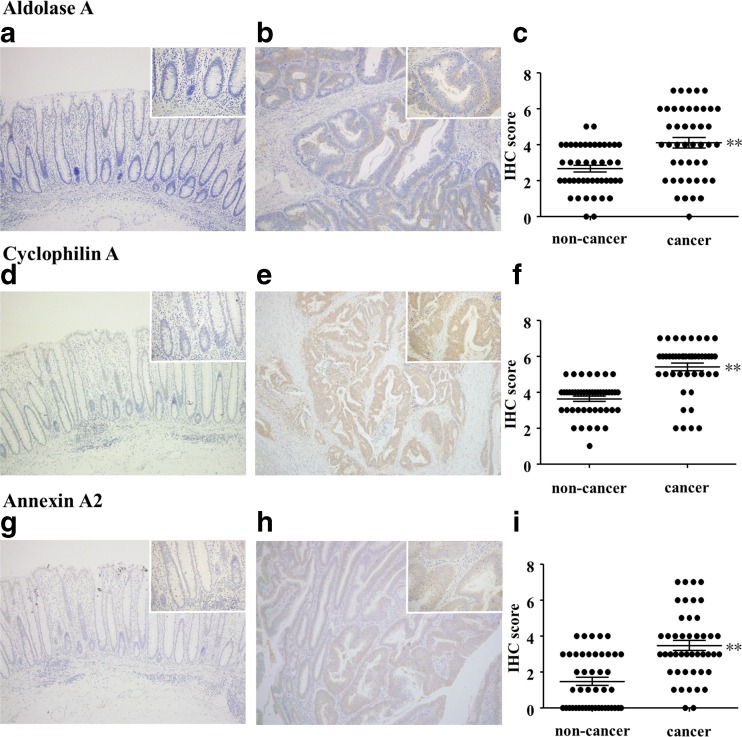
Fig. 6.
IHC validation of spectral counting results. Expression levels of aldolase A, cyclophilin A, and annexin A2 were validated by IHC. Representative images of non-cancer regions (a, d, and g) and cancer regions (b, e, and h). Graphs of IHC scores are shown in (c), (f), and (i). Cancer regions showed significantly stronger expression of these three proteins, which is consistent with spectral counting data. *p < 0.05; **p < 0.001. Original magnification, 100×; insets, 400×

