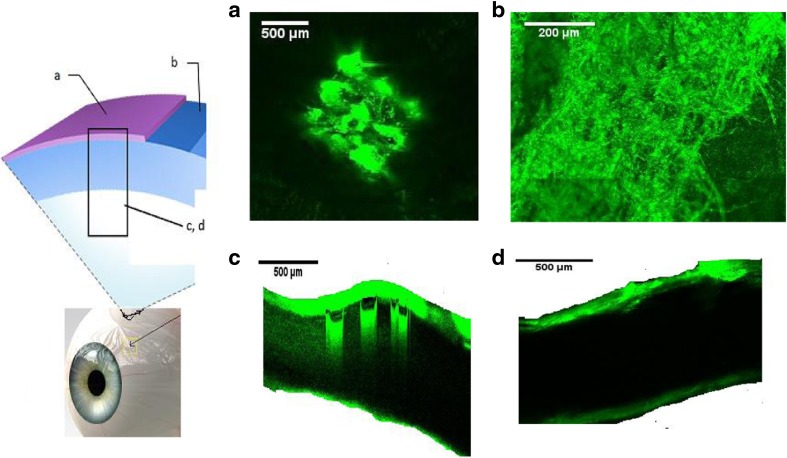
Fig. 9.
Schematic diagram on the left hand side represents the collection and processing of confocal images of scleral tissues following application of FD70-loaded PVP K29/32 MN arrays (F2), where a topical image of tissue after 5 min following insertion of MN array, b cross-section image of tissue after 5 min following MN array insertion, c topical image at a depth of 80 μm from surface of the tissue after 1 h following MN insertion and d cross section image of tissue 1 h after applying an aqueous solution of FD 70 (at 2 mg/ml)

