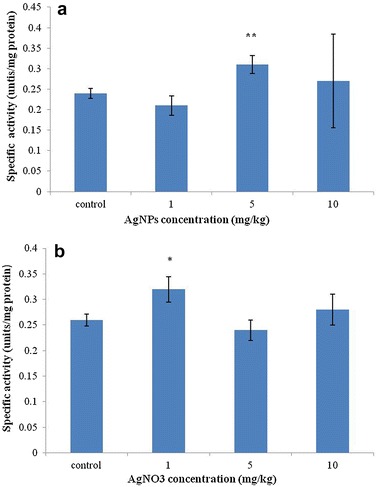
Fig. 2.

GST activity of protein extracts from F. candida treated with AgNPs and AgNO3 determined by means of CDNB as a model substrate. a GST activity of protein extracts from test animals exposed to different concentrations of AgNPs; b GST activity of protein extracts from test animals exposed to different concentrations of AgNO3. Measurements were conducted three times. Error bars indicate standard deviations. Single asterisks indicate significance at P < 0.05; double asterisks indicate significance at P < 0.01 (using ANOVA with Dunnett’s comparison)
