Fig. 3.

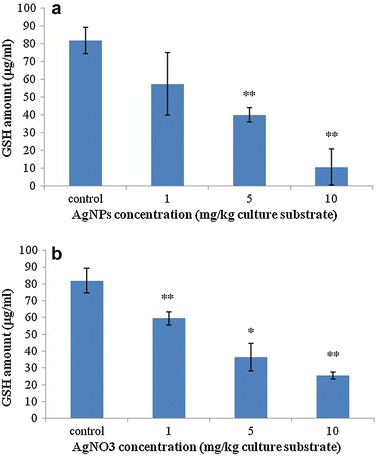
Size of GSH pool from F. candida treated with AgNPs and AgNO3. a Amount of total GSH from test animals treated with AgNPs; b pool of GSH from F. candida treated with AgNO3. The size of the GSH pool decreased with increasing concentration of AgNPs and AgNO3. Tests were repeated three times. Error bars indicate standard deviations. Single asterisks indicate significance at P < 0.05; double asterisks indicate significance at P < 0.01 (using ANOVA with Dunnett’s comparison)
