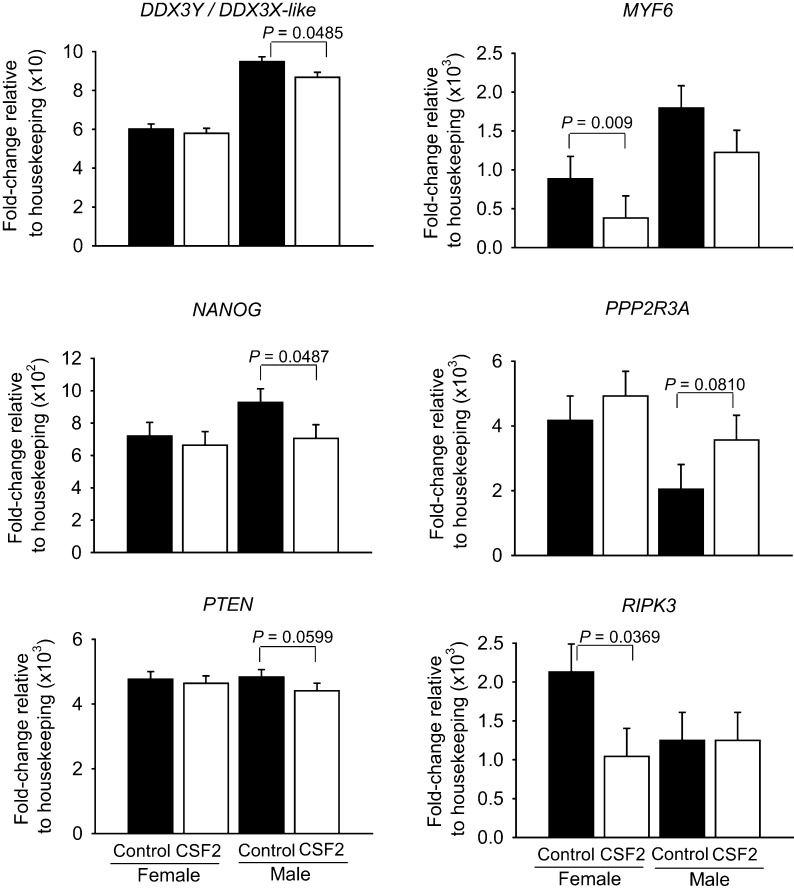
Figure 3.
Genes affected by the main effect of CSF2. Data represent the fold change of level of expression relative to housekeeping genes. Fold change was multiplied by the factor shown on the Y axis for ease in graphing. Results are least-squares means ± s.e.m. of eight biological replicates of 50 pooled morulae each. P value for the main effects of sex and CSF2 treatment (trt) are shown for all effects where P < 0.10 or less. In addition, pairwise comparisons of effects of CSF2 were performed separately for female and male embryos and those effects where P was <0.10 or less are indicated by the brackets.

 This work is licensed under a