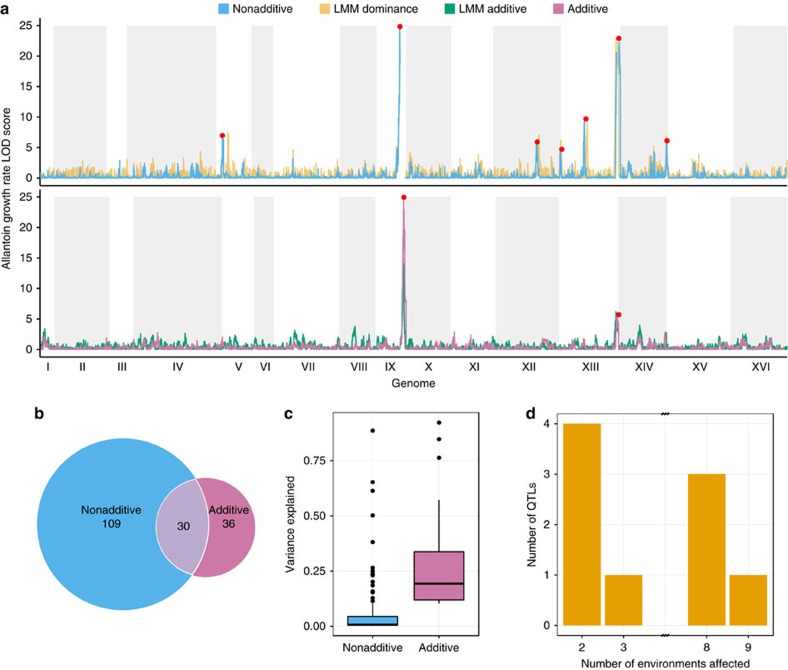
Figure 3. Cost-efficient QTL mapping in yeast POLs.
QTLs were mapped across 6,642 genomes and 18 traits based on additive and nonadditive contributions. QTLs were validated as additive or dominant genetic contributions using Linear Mixed Models (LMM). (a) QTL signal strength (LOD score, y-axis) as a function of genomic position (x-axis), for growth rate on allantoin as sole nitrogen source, using additive (LMM and non-LMM; lower panel) and nonadditive (non-LMM and LMM only capturing dominance; upper panel) models. Red dots indicate significant (FDR, q=10%) QTL calls. White/grey fields indicate chromosome spans. (b) Venn diagram of significant QTLs capturing additive and nonadditive genetic contributions. All 18 phenotypes (growth rate and mean growth over nine environments) were considered, with pleiotropic QTLs counted multiple times. (c) Tukey boxplot showing the fraction of variance explained by additive (purple) and nonadditive (blue) significant QTLs (non-LMM models). (d) Histogram of pleiotropic QTLs. A QTL was counted as shared across environments if peaks were within 10 kb of each other. No QTLs were significant in 4, 5, 6 or 7 environments.

