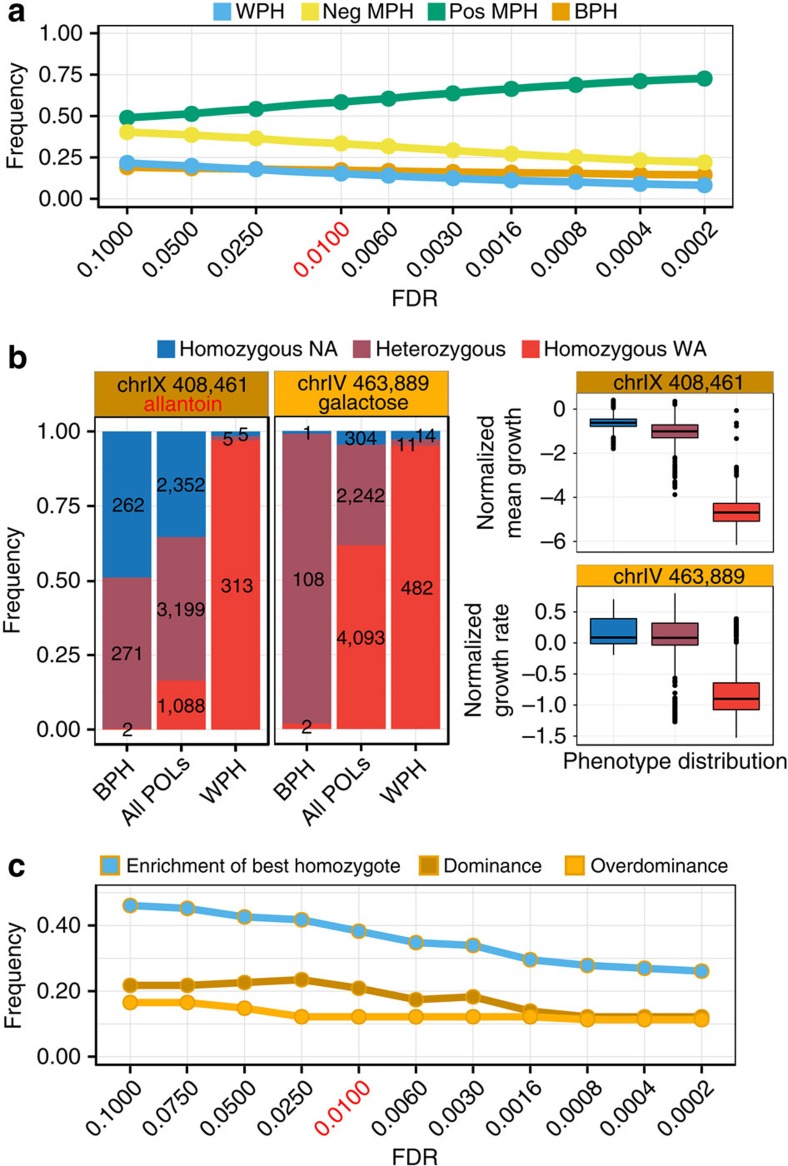
Figure 4. Explaining heterosis by intralocus interactions.
(a) Frequencies of the heterotic POLs (y-axis) as a function of a range of FDR significance cut-off (q) values (x-axis). Line colour=type of heterosis. Red text=FDR q-value chosen for downstream analysis (a,c). (b) Left panel: example of QTLs called as contributing to best parent heterosis by dominance (dark orange) and by overdominance (light orange) respectively. Dominance was called as enrichment of strongest homozygote and overdominance as enrichment of heterozygous state among BPH POLs as compared with all POLs (left panel). Right panel: phenotype (top: allantoin, bottom: galactose) distribution depending on genotype composition at the same QTLs. (c) The frequency of QTLs called as contributing by enrichment of the best homozygote, dominance and overdominance respectively (y-axis) as a function of FDR significance cutoff (q) values (x-axis). The dominance contribution is a subfraction of the contributions from enrichment of the best homozygote. Note: we show the outcomes of a range of FDR cut-off values to illustrate the robustness of conclusions; the cut-offs used for downstream analysis was set beforehand and not influenced by the results. Best parent heterosis (BPH); mid parent heterosis (MPH); worst parent heterosis (WPH).

