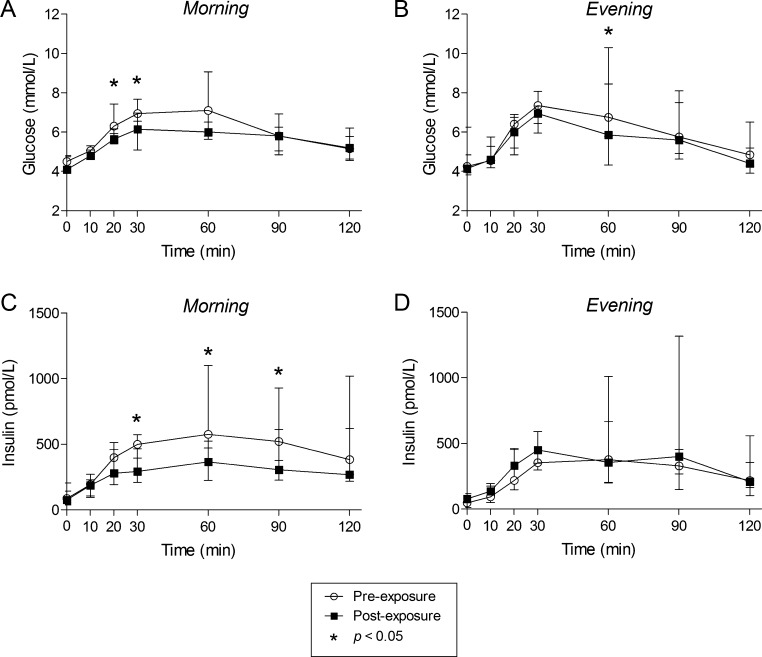
Figure 3.
Glucose and insulin values (median + IQR) obtained during the OGTT in obese subjects before the administration of bromocriptine (round icons) and after the administration of bromocriptine (square icons). (A) Glucose values obtained before and after the administration of bromocriptine in the morning. (B) Glucose values obtained before and after the administration of bromocriptine in the evening. (C) Insulin values obtained before and after the administration of bromocriptine in the morning. (D) Insulin values obtained before and after the administration of bromocriptine in the evening.

 This work is licensed under a