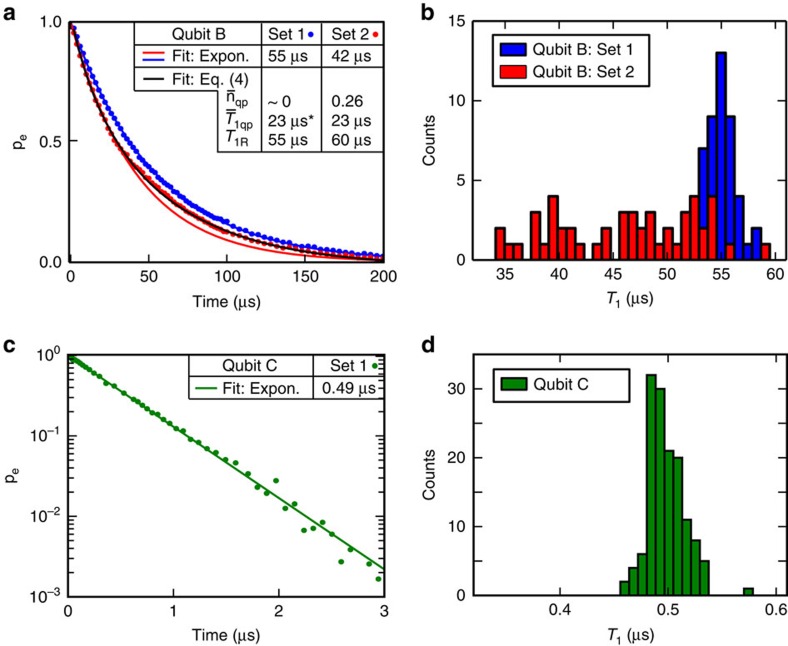
Figure 4. T1 temporal variation and quasiparticles.
(a) Energy-relaxation measurements (set 1 and set 2) at ωq=ΔB for qubit B. Each set comprises the average of 50 individual decay traces acquired sequentially in 4-min intervals. Set 1 exhibits purely exponential decay with T1=55 μs, whereas set 2 (acquired 17 h after set 1) exhibits a non-exponential decay function. The black line is a fit to equation (3) assuming the non-exponential decay is due to quasiparticle fluctuations (see text). Inset: tabulation of the values obtained from fitting functions. The ‘*' indicates an assumed value from set 2 (not a fit value). (b) Histograms of T1 values obtained by exponential fits of the individual traces forming the two data sets in a. For set 2, the fitting is restricted to the first 40 μs to capture primarily the fast initial decay. (c) Energy-relaxation measurements at ωq=ΔC for qubit C. The exponential decay function is manifest as a linear fit on the log plot with time constant T1=0.49 μs. (d) Histograms of T1 values obtained from repeated measurements of qubit C. Both the exponential decay function (c) and the consistently tight T1 distribution (d) indicate a relative insensitivity to quasiparticle number fluctuations.

