
Figure 5. Calibration of engineered noise.

(a) Resonator transmission spectra measured with the qubit prepared in the ground and excited states. In contrast to typical transmon qubits with ωq<ωr, an excited-state C-shunt flux qubit shifts the resonator to higher frequencies because of interactions with higher-level qubit transitions. (b) Engineered thermal-photon noise source. A coherent tone near the resonator frequency is mixed with white-noise of nominally equal power from two independent arbitrary waveform generators (AWGs) applied to the in-phase (I) and quadrature (Q) ports of the I/Q mixer. The AWG noise bandwidth (80 MHz) is much greater than the cavity linewidth, creating effectively a thermal-photon noise source with power Padd. (c) Qubit spectral line shape (dots) and lorentzian fits (solid lines) for various added noise powers Padd. The equivalent photon population  added to the resonator is derived from d. The blue trace corresponds to no added noise from the source in b. (d) Stark-shifted qubit frequency versus applied noise power (dots). Coloured dots correspond to traces in c. Combining the linear fit (solid line) with the first-order dependence of Stark shift on photon population (equation (4)) yields the power-per-added-photon
 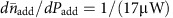 in the low-power limit. Inset: wider range of applied noise powers; dashed box indicates the range in the main panel. At large photon populations
  the frequency shift becomes nonlinear, following equation 43 in ref. 40 (solid line). (e) Spin-echo decay (dots) with exponential fit (solid lines) for several values of added photons. Inset: spin-echo pulse sequence. (f) Spin-echo pure-dephasing rate (echo decay rate without the T1 contribution) plotted versus injected photon population (dots). The linear fit (solid line) has slope
 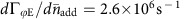 , in agreement with the value of 2.5 × 10⁶ s−1 calculated from equation (5). The intercept indicates a residual photon population
  in the resonator.